
What is gamma exposure (GEX)? Dealer hedging explained
Gamma exposure (GEX) explained: how dealer hedging moves SPX, ES and NQ, positive vs. negative gamma, the zero gamma flip, and call and put walls.
Gamma exposure (GEX) is an estimate of how much stock or futures that options dealers must buy or sell to stay hedged as the market moves. When dealers are long gamma, their hedging pushes against the move - they sell rallies and buy dips - and the market tends to stay range-bound. When dealers are short gamma, their hedging pushes with the move, and the market tends to trend and expand. The price where one regime turns into the other is called zero gamma, or the gamma flip.
That one idea explains a lot of what US index traders see every day: why the S&P 500 sometimes pins to a round number for hours, and why on other days a 30-point drop in ES turns into 80 points with no news at all.
This guide explains what gamma exposure is, how it’s calculated, how to read a GEX chart, and where it falls short.
Key takeaways
- GEX measures dealer hedging pressure, not market direction.
- Positive GEX (dealers long gamma) tends to mean lower volatility, mean reversion and “sticky” price.
- Negative GEX (dealers short gamma) tends to mean higher volatility, trending moves and faster breaks.
- Zero gamma is the price where the regime flips. It’s often the most important line on the chart.
- Call walls and put walls are strikes with the largest gamma - frequent magnets, ceilings and floors.
- Expiration matters. 0DTE and weekly gamma decays fast; monthly and quarterly gamma persists.
First, what is gamma?
Every option has a delta: how much its price changes for a $1 move in the underlying. A call with a delta of 0.50 gains about 50 cents when the stock rises a dollar.
Gamma is the rate of change of delta. It tells you how much delta itself moves for each $1 move in the underlying. Gamma is highest for options that are at the money and close to expiration - which is why 0DTE SPX options, now a large share of daily SPX volume, carry so much of it.
For a trader holding one option, gamma is just a number on the screen. For the firms on the other side of millions of contracts, it is a hedging obligation that changes every tick.
Why dealers hedge (and why it matters to you)
When you buy or sell an SPX option, the counterparty is usually a market maker - often called a dealer. Dealers aren’t in the business of betting on direction. They earn the bid-ask spread and try to stay delta neutral by hedging their options with the underlying: S&P 500 futures, SPY, or a basket of stocks.
Here’s the catch: because of gamma, a dealer’s delta changes as price moves, so the hedge has to be adjusted continuously. Those adjustments are real orders that hit the market. Multiply them across the entire options market and they become one of the largest, most predictable flows in US equities.
Gamma exposure is simply an attempt to estimate the size and direction of those flows.
Positive gamma vs. negative gamma
The direction of dealer hedging depends on whether dealers are net long or short gamma.
Positive gamma: dealers dampen the move
When dealers are long gamma, their delta rises as the market rises and falls as the market falls. To stay neutral they must sell into strength and buy into weakness. That flow leans against every move, so:
- intraday ranges tend to be tighter,
- realized volatility tends to fall,
- price often gravitates to - and “pins” near - large strikes,
- breakouts tend to fail and fade.
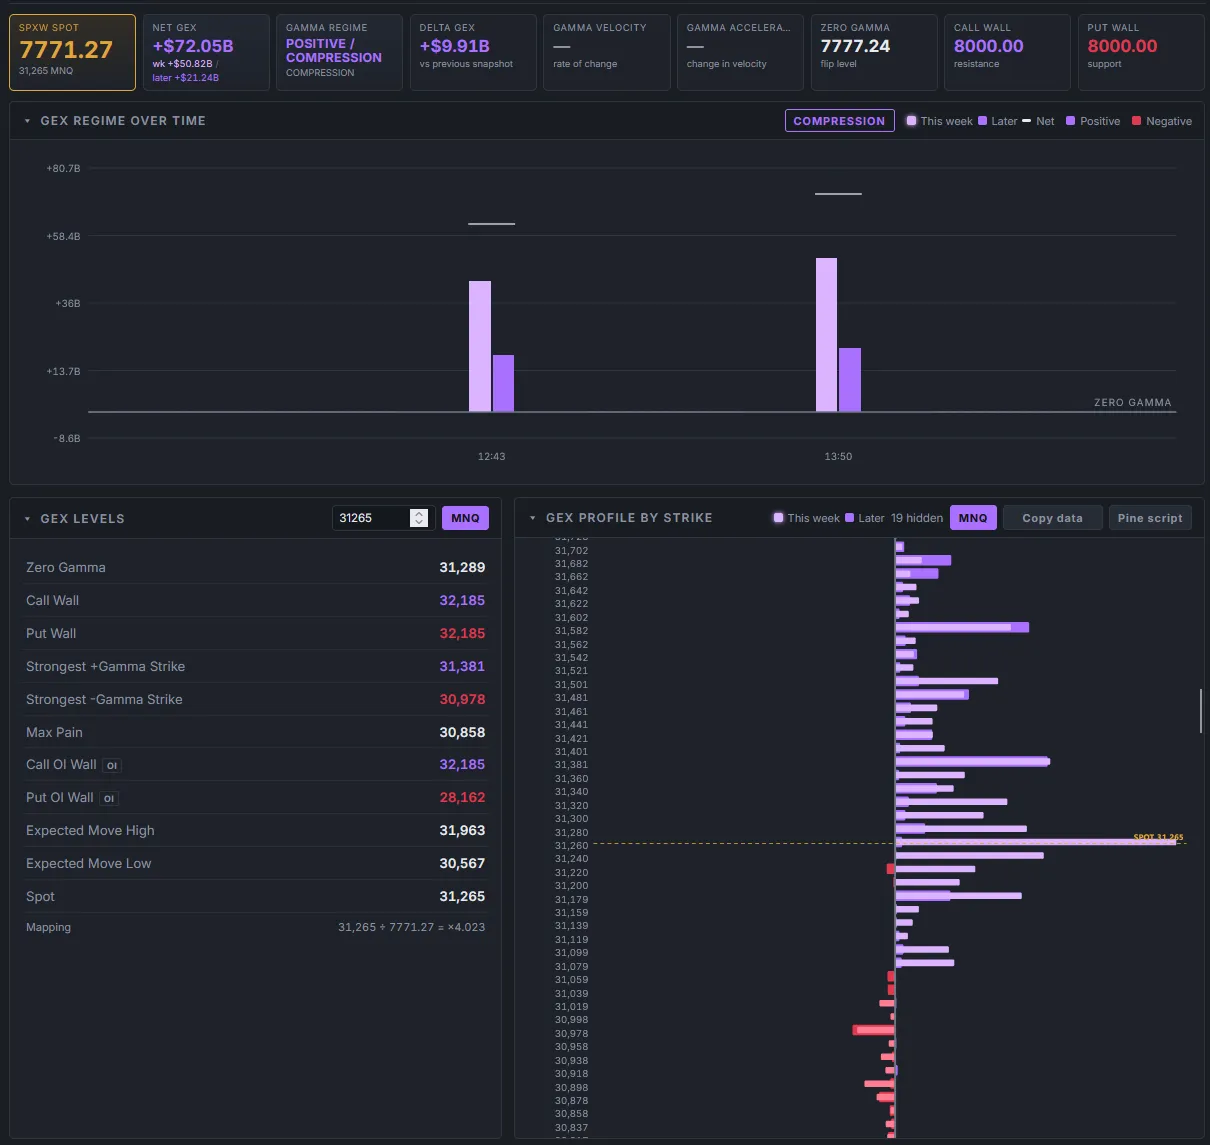
Positive gamma: net GEX is strongly positive and most of the exposure sits around spot. Dealers hedge against the move, so ranges tend to hold.
Negative gamma: dealers amplify the move
When dealers are short gamma, the math reverses. As price falls, they become longer and must sell more to stay hedged. As price rises, they become shorter and must buy more. Their hedging chases the market, so:
- moves extend further and faster,
- realized volatility tends to rise,
- support levels break more easily,
- sharp reversals are also more likely, because the same flows work in both directions.
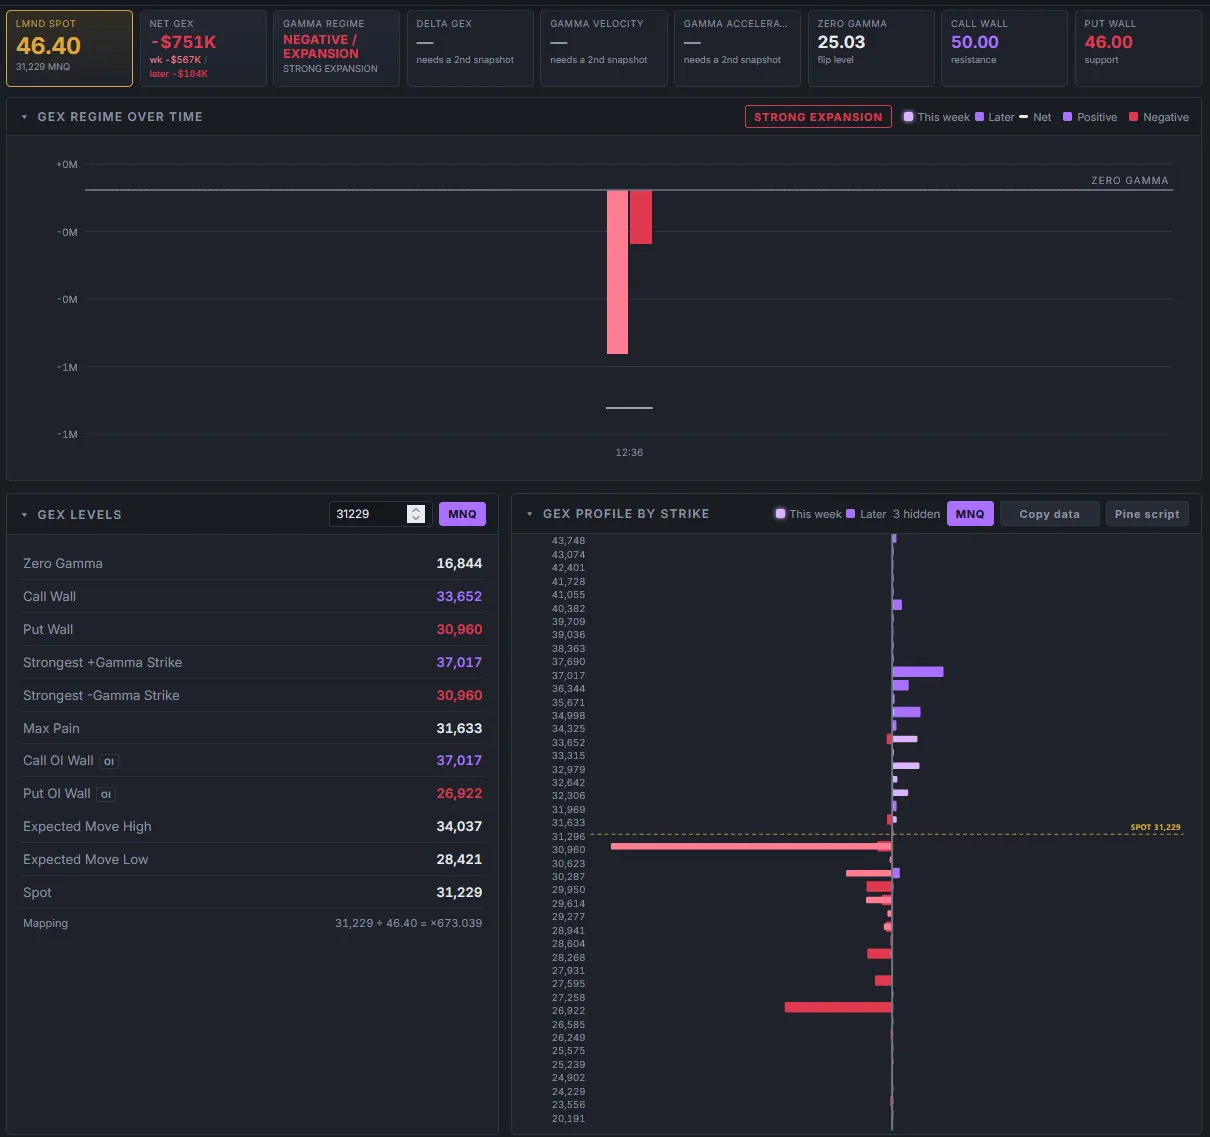
Negative gamma on a single stock: net GEX is negative and the largest bars are puts below spot. Dealers hedge with the move, so breaks can run.
Positive vs. negative gamma at a glance
| Positive gamma (long) | Negative gamma (short) | |
|---|---|---|
| Dealer hedging | Sells rallies, buys dips | Buys rallies, sells dips |
| Effect on price | Dampens moves | Amplifies moves |
| Typical volatility | Lower, compressing | Higher, expanding |
| Typical behavior | Ranges, mean reversion, pinning | Trends, breakouts, fast reversals |
| Common approach | Fade the edges of the range | Respect momentum, size down |
Zero gamma: where the regime flips
If you add up dealer gamma across every strike, you get a single net GEX number. As price changes, that number changes too - and at some price it crosses zero.
That price is zero gamma, also called the gamma flip or flip level. It’s often the single most useful output of a GEX model:
- Above zero gamma, dealers are estimated to be net long gamma. Expect calmer, more two-sided trade.
- Below zero gamma, dealers are estimated to be net short gamma. Expect wider ranges and faster moves.
Many of the sharpest sell-offs in the S&P 500 begin with price slipping below the flip level, where every leg lower forces more hedging-related selling.
Call walls, put walls and other GEX levels
A GEX profile shows exposure strike by strike, which reveals where hedging pressure is concentrated.
- Call wall - the strike with the largest positive gamma, usually above spot. It often acts as resistance, because dealer selling intensifies as price approaches it.
- Put wall - the strike with the largest negative gamma, usually below spot. It often acts as support in a positive gamma market - and as an accelerant if it breaks in a negative gamma market.
- Strongest positive and negative gamma strikes - the biggest single concentrations, frequent magnets during the session.
- Max pain - the strike where the most option value would expire worthless. It tends to matter most into expiration.
- Expected move - the range implied by option prices for the period, a useful frame for how far the market “should” travel.
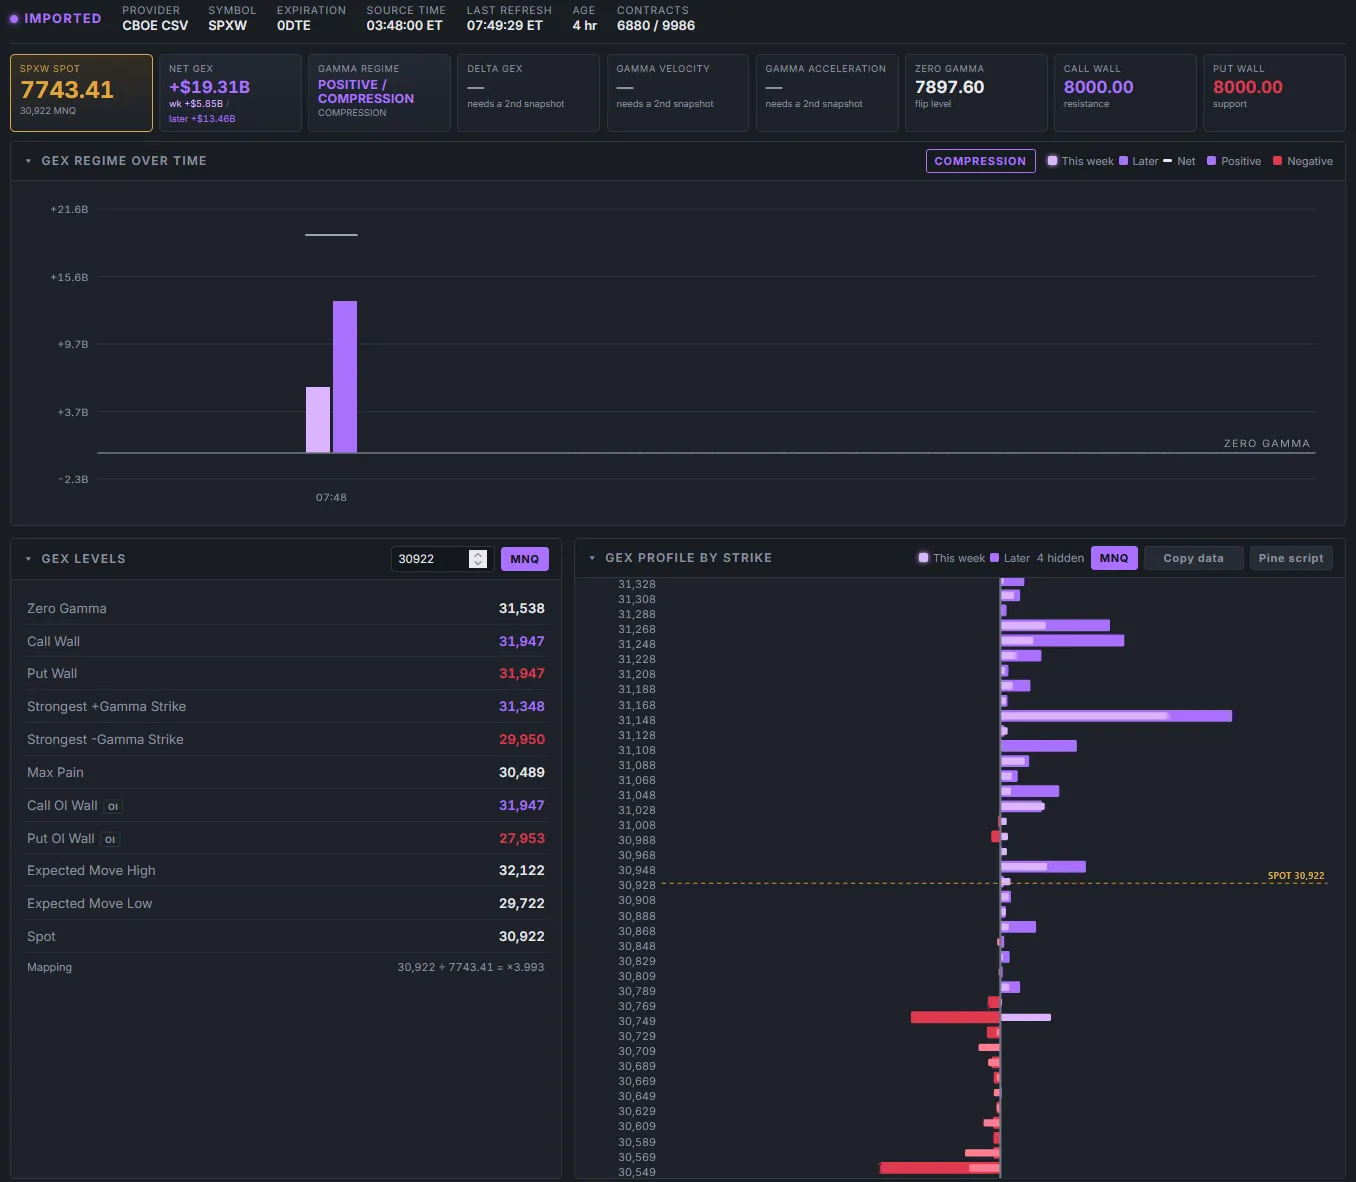
A full GEX profile: net GEX and regime at the top, key levels on the left, exposure by strike on the right - split between this week’s expirations and later ones.
How gamma exposure is calculated
The standard formula estimates the dollar value dealers must trade for a 1% move in the underlying. For each option contract:
GEX = gamma × open interest × contract multiplier × spot² × 0.01
Calls are counted as positive and puts as negative. That sign convention comes from a common assumption about who holds what: investors tend to sell calls (covered calls, overwriting) and buy puts (portfolio protection), which leaves dealers long calls and short puts. The exposure of every strike and expiration is then summed into a profile and a net total.
A worked example. Say SPX is at 7,700 and one strike has an option gamma of 0.0015 with 10,000 contracts of open interest. SPX options have a $100 multiplier:
0.0015 × 10,000 × 100 × 7,700² × 0.01 ≈ $890 million per 1% move
In other words, if SPX moved 1% (about 77 points), dealers would need to trade roughly $890 million of S&P 500 exposure to rebalance that one strike’s hedge. Across the full SPX chain, net GEX regularly runs into the tens of billions of dollars.
Why expiration matters: 0DTE, weekly and monthly gamma
Gamma isn’t static. It grows as expiration approaches - an at-the-money option expiring today has far more gamma than the same strike a month out - and it disappears entirely at expiration.
That has practical consequences for US index traders:
- 0DTE and weekly options put enormous gamma right around spot, which can pin SPX intraday - then vanish at the 4:00 p.m. ET close.
- Monthly options expiration (OPEX), on the third Friday, removes a large block of gamma at once. Markets that were pinned before OPEX often loosen up after it.
- Quarterly expirations in March, June, September and December are the largest of all.
This is why it helps to split GEX into this week versus later expirations. Two days can show the same headline net GEX, yet one is built on gamma that expires on Friday and the other on gamma that will still be there next month.
How traders use GEX on ES, NQ and MNQ
Most futures traders never trade SPX options directly, but they still feel SPX dealer hedging. The usual approach is to compute GEX from the SPX chain and map the levels onto the futures contract using the live price ratio - to ES or MES for the S&P 500, or to NQ or MNQ for the Nasdaq-100.
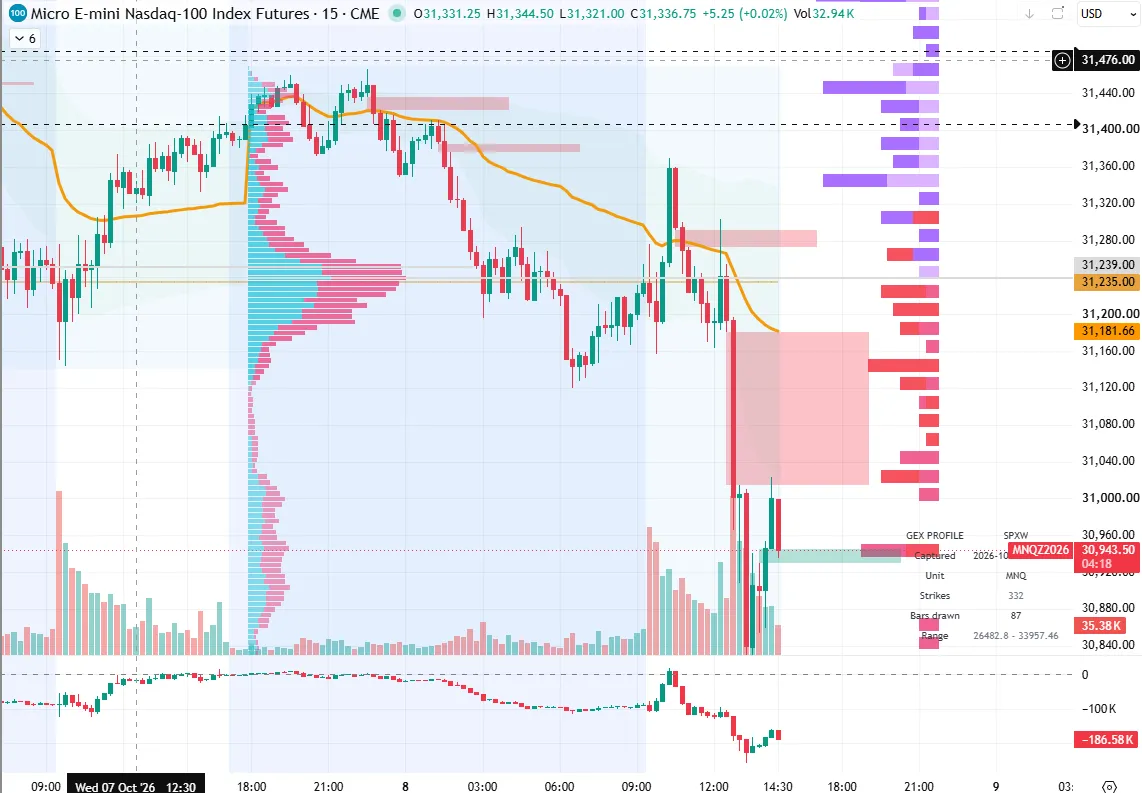
GEX mapped to MNQ on a 15-minute chart: the strike profile sits beside price, so walls and the flip level are visible where you actually trade.
Common ways traders put GEX to work:
- Set the day’s expectation. Positive gamma above the flip suggests fading extremes; negative gamma below it suggests respecting momentum and keeping stops wider or size smaller.
- Mark the levels before the open. Zero gamma, the call wall and the put wall go on the chart alongside your usual support and resistance.
- Watch for regime changes. A move through zero gamma during the session can change the character of the day in minutes.
- Plan around expiration. Expect pinning into large 0DTE or OPEX strikes, and more freedom of movement once that gamma rolls off.
- Combine with your own edge. GEX tells you how the market is likely to move, not where. It works best as context for a setup you already trade.
The limits of gamma exposure
GEX is useful, but it’s a model, and every model has blind spots:
- Dealer positioning is assumed, not known. The “dealers long calls, short puts” convention is often right for index options but can be wrong, especially for single stocks with heavy speculative call buying.
- Open interest updates once a day. The OCC publishes open interest overnight, so positions opened and closed intraday - including much of the 0DTE flow - aren’t fully visible.
- Volume-based shortcuts are noisier. Some tools estimate GEX from volume instead of open interest, which counts churn rather than positions that are actually held.
- Other Greeks matter too. Vanna (sensitivity to implied volatility) and charm (sensitivity to time) drive their own hedging flows, especially around expiration and volatility events.
- Macro wins. A CPI surprise, an FOMC decision or an earnings shock can overwhelm hedging flows in either regime.
Use GEX to understand the environment you’re trading in, and let your own rules and risk management make the decisions.
How Premo helps
Premo’s members-only GEX & Strike Profiles tool is built around those limits. It uses open interest, not volume, measures real dollar gamma per 1% move with each contract’s actual multiplier, interpolates zero gamma between strikes instead of snapping to the nearest one, and splits every strike by expiration so you can see what decays this week and what persists. SPX levels are mapped to MNQ with the live price ratio and can be exported to TradingView as a Pine Script in one click. See how access works on GEX & Strike Profiles.
This article is educational and is not investment advice. Gamma exposure is a model of dealer positioning derived from options data; it describes possible hedging flows, not future prices. Trading futures and options involves substantial risk of loss.
Frequently asked questions
What does GEX stand for?
GEX stands for gamma exposure. It is an estimate of the total gamma that options market makers (dealers) hold across all strikes and expirations of an underlying, expressed as the dollar amount of the underlying they would need to buy or sell to stay hedged for a 1% move.
Is positive gamma bullish?
Not necessarily. Positive gamma describes volatility, not direction. When dealers are long gamma they sell rallies and buy dips to stay hedged, which tends to dampen moves and keep price in a range. The market can still trend higher or lower in positive gamma - usually just more slowly.
What is the zero gamma level?
Zero gamma, also called the gamma flip, is the price at which total dealer gamma exposure changes sign. Above it, dealers are estimated to be net long gamma and hedging tends to calm the market. Below it, dealers are estimated to be net short gamma and hedging tends to amplify moves.
What is a call wall and a put wall?
The call wall is the strike with the largest positive gamma exposure, usually above the market. The put wall is the strike with the largest negative gamma exposure, usually below it. They often act as resistance and support because dealer hedging is heaviest there, but they are zones to watch, not guarantees.
How often does GEX change?
Open interest for US-listed options is published by the OCC once per trading day, so the positioning behind GEX updates overnight. Gamma itself changes continuously with price, time and implied volatility, so the profile and the zero gamma level shift during the session, especially on 0DTE-heavy days.
Does GEX work for ES, NQ, MNQ, SPY and QQQ?
Yes, indirectly. SPX options are the deepest index options market, so most traders compute GEX from SPX and map the levels to S&P 500 futures (ES, MES) or to Nasdaq futures (NQ, MNQ) with the live price ratio. SPY and QQQ have their own option chains and can be analyzed directly.
Is GEX a trading signal?
No. GEX is a model of how dealer hedging may influence price. It describes the likely character of the session - range-bound or volatile - and where hedging pressure is concentrated. It does not predict prices and should be combined with your own plan and risk management.