
Free tool
Trading expectancy calculator
Does your strategy make money on average? Enter your win rate, average win and average loss.
The formula
Expectancy = (win rate × average win) − (loss rate × average loss). It is the average amount one trade makes or loses over many trades. Win rate alone can't tell you that. A 70% win rate loses money if the losses are three times the wins.
| R:R | Breakeven win rate |
|---|---|
| 0.5 : 1 | 66.7% |
| 1 : 1 | 50.0% |
| 1.5 : 1 | 40.0% |
| 2 : 1 | 33.3% |
| 3 : 1 | 25.0% |
An example in MNQ
The numbers filled in above: you risk 37.5 points ($75 on one MNQ) and take profit at 75 points ($150). You win 40% of the time. Each trade makes $15 on average: 0.40 × $150 − 0.60 × $75. That's 0.2R, or $1,500 over 100 trades before you change anything but the number of contracts. The full walkthrough is in Expectancy: the number that decides your edge.
Where your numbers should come from
From your trade log, not your memory. Use averages after fees, from one setup at a time, over at least 30 trades. To see how win rate and R:R trade off on one chart, try the win rate vs R:R calculator. To size the next trade, use the futures position size calculator. To see how far your trades went for and against you, read MFE and MAE explained. And to check whether your expectancy holds up without your biggest winners and losers, read base hits or home runs?
Your real expectancy, in Premo
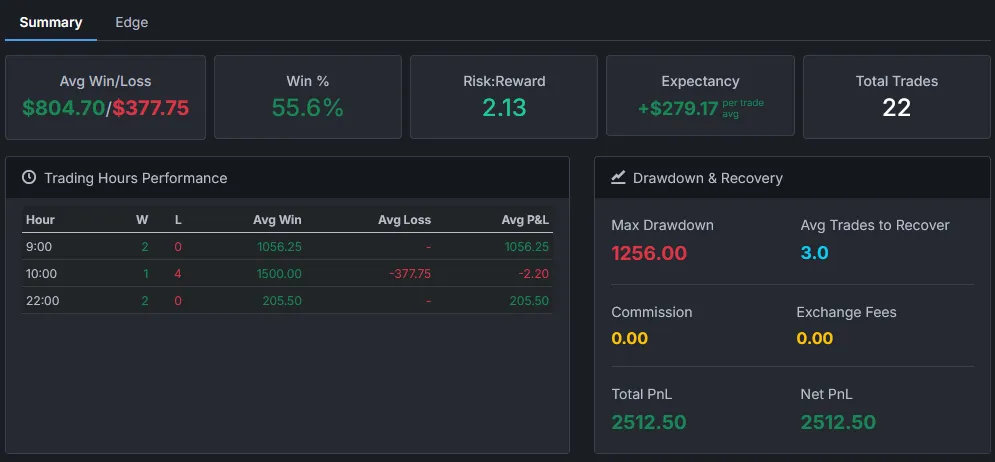
Import your fills and Premo works these numbers out from every closed trade, for any day, week, month or year and any account. Its Edge tab then shows the win rate or R:R that would take you to the next level of expectancy, and how much of your P&L rests on a few winners. See performance analytics.
Questions
What is a good trading expectancy?
Any expectancy above zero after fees means the strategy makes money on average. Comparing it in R (expectancy divided by your average loss) makes it comparable across account sizes: 0.1R to 0.3R per trade is a solid edge for an active day trader.
How do you calculate expectancy?
Expectancy = (win rate x average win) - (loss rate x average loss). With a 40% win rate, a $150 average win and a $75 average loss: 0.40 x 150 - 0.60 x 75 = $15 per trade.
What win rate do I need to break even?
Breakeven win rate = 1 / (1 + R:R), where R:R is average win divided by average loss. At 2:1 you break even at 33.3%, at 1:1 at 50%, and at 3:1 at 25%.
Can you be profitable with a low win rate?
Yes, if your average win is large enough. A 33% win rate is profitable when the average win is more than twice the average loss. Many trend-following and breakout traders win fewer than half their trades.
How many trades do I need for expectancy to mean anything?
At least 30 trades of the same setup to start, and more is better. A handful of trades can show a positive expectancy by luck, especially when one outlier win carries the total.
For education only. Not financial advice. Past results do not guarantee future results.