
Free tool
Win rate vs R:R calculator
A high R:R lets you lose most of your trades and still make money. A low R:R needs you to be right almost every time. Move the sliders and see where your strategy sits.
How to read the chart
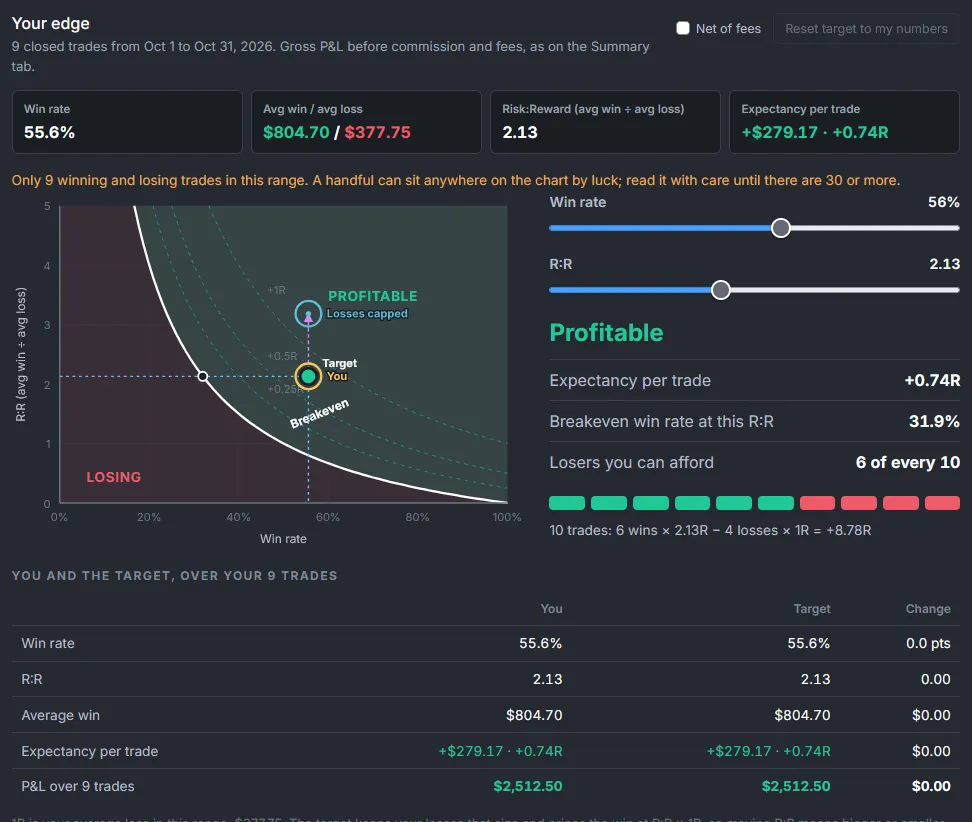
Every point on the map is a strategy: its win rate across, its R:R (average win ÷ average loss) up. The white curve is breakeven, where wins and losses cancel out. Above and to the right of it, the strategy makes money; below and to the left, it loses. The dashed lines mark +0.25R, +0.5R and +1R of expectancy per trade.
The curve is steep on the left and flat on the right. That's the whole point: at a 3:1 R:R, winning 30% of the time is enough. At 0.5:1, even 65% isn't.
The formula
Expectancy (in R) = win rate × R:R − loss rate, and the breakeven win rate = 1 ÷ (1 + R:R). Multiply expectancy by your risk per trade to get dollars: +0.2R at $100 of risk is $20 per trade on average.
Breakeven win rate by R:R
| R:R | Breakeven win rate | Losers you can afford in 10 trades |
|---|---|---|
| 0.25 : 1 | 80.0% | 1 |
| 0.5 : 1 | 66.7% | 3 |
| 1 : 1 | 50.0% | 4 |
| 1.5 : 1 | 40.0% | 5 |
| 2 : 1 | 33.3% | 6 |
| 3 : 1 | 25.0% | 7 |
| 4 : 1 | 20.0% | 7 |
Use your real numbers
The R:R that matters is the one you actually get, not the one on your order ticket. A trader with a planned 2:1 who cuts winners early and lets losers run can end up at 0.5:1. Take your win rate and your average win and loss from your journal. For the dollar version, use the expectancy calculator. To price one trade from its entry, stop and target, use the risk-reward calculator. To choose a stop and target, read risk-reward ratio. To size the trade, use the futures position size calculator.
Your own point, in Premo
Premo's Edge tab draws this map from your closed trades: your win rate and R:R as a fixed point, with 1R as your average loss, and a target you set with the same sliders. It also suggests what would move you to the next line, and shows what a cap on your biggest losses would have done. See the Edge tab.
Questions
What win rate do I need to be profitable?
It depends on your R:R, the average win divided by the average loss. Breakeven win rate = 1 / (1 + R:R). At 1:1 you need more than 50%, at 2:1 more than 33.3%, at 3:1 more than 25%, and at 0.5:1 more than 66.7% - before fees.
Is a high win rate or a high R:R better?
Neither on its own. A 70% win rate loses money at 0.3 R:R, and a 30% win rate makes money at 3 R:R. What matters is the combination, measured as expectancy: win rate x R:R minus loss rate.
How many losing trades can I have and still make money?
With an R:R of R, you can lose a share of trades just under R / (1 + R) and still profit. At 2:1 that is up to 6 losers in every 10 trades; at 3:1, up to 7; at 1:1, up to 4.
Should R:R be planned or actual?
Actual. Your planned target and stop give a planned R:R, but early exits, slippage and moved stops change it. Use your real average win divided by your real average loss, from your trade log.
Can you account for fees?
Yes: use your averages after fees. The calculator works in units of risk (R) and leaves fees out, and fees reduce every win and add to every loss, so with averages before fees expect your real breakeven win rate to be a little higher.
For education only. Not financial advice. Results are before fees and assume each loss is one unit of risk.