
Risk-reward ratio: formula, breakeven win rate and limits
The risk-reward ratio explained: how to calculate it, the breakeven win rate for 1:1, 1:2 and 1:3, why costs move it, and why planned R is not realized R.
The risk-reward ratio compares how much you stand to lose on a trade with how much you stand to make. Risk is the distance from your entry to your stop; reward is the distance from your entry to your target. A trade that risks 20 points to make 40 has a risk-reward ratio of 1:2 - you are risking one unit to make two.
It is one of the first numbers new traders learn, and one of the most misused. A 1:3 ratio sounds better than a 1:1, but a ratio on its own says nothing about whether a strategy makes money. That depends on how often the target is actually reached - and on whether your exits match your plan at all.
This guide covers the formula, the breakeven win rate for every common ratio, how costs move it, and the difference between the reward-to-risk you plan and the one you actually get.
Key takeaways
- Risk-reward ratio = risk ÷ reward, from entry to stop and entry to target. 1:2 means risking 1 to make 2.
- Breakeven win rate = 1 ÷ (1 + R), where R is reward ÷ risk. At 1:2 you need to win more than 33.3% of trades.
- Costs raise the bar. Commissions and fees shrink every win and enlarge every loss.
- Planned R is not realized R. Early exits and moved stops change the ratio you actually trade.
- The ratio is half the answer. Expectancy combines it with win rate and decides whether you have an edge.
How to calculate the risk-reward ratio
Risk-reward ratio = (entry − stop) ÷ (target − entry)
For a short, flip the signs: the stop sits above the entry and the target below it.
Traders write the same idea two ways. Risk-reward puts risk first (1:2). Reward-to-risk, often just called R, puts reward first and is written as a single number (2R). This guide uses both, and they always describe the same trade.
A worked example on MNQ
You buy one Micro E-mini Nasdaq-100 contract (MNQ). Each index point is worth $2. Your stop is 20 points below your entry and your target is 40 points above it.
| Points | Dollars (1 MNQ) | |
|---|---|---|
| Risk: entry to stop | 20 | $40 |
| Reward: entry to target | 40 | $80 |
| Risk-reward ratio | 1:2 | 1:2 |
| Reward-to-risk (R) | 2 | 2 |
Size doesn’t change the ratio. Five contracts risk $200 to make $400 - still 1:2. To run your own entry, stop and target on any contract, use the free risk-reward calculator.
The breakeven win rate for each ratio
The higher your reward-to-risk, the less often you need to be right. The win rate where you neither make nor lose money, before costs, is:
Breakeven win rate = 1 ÷ (1 + R)
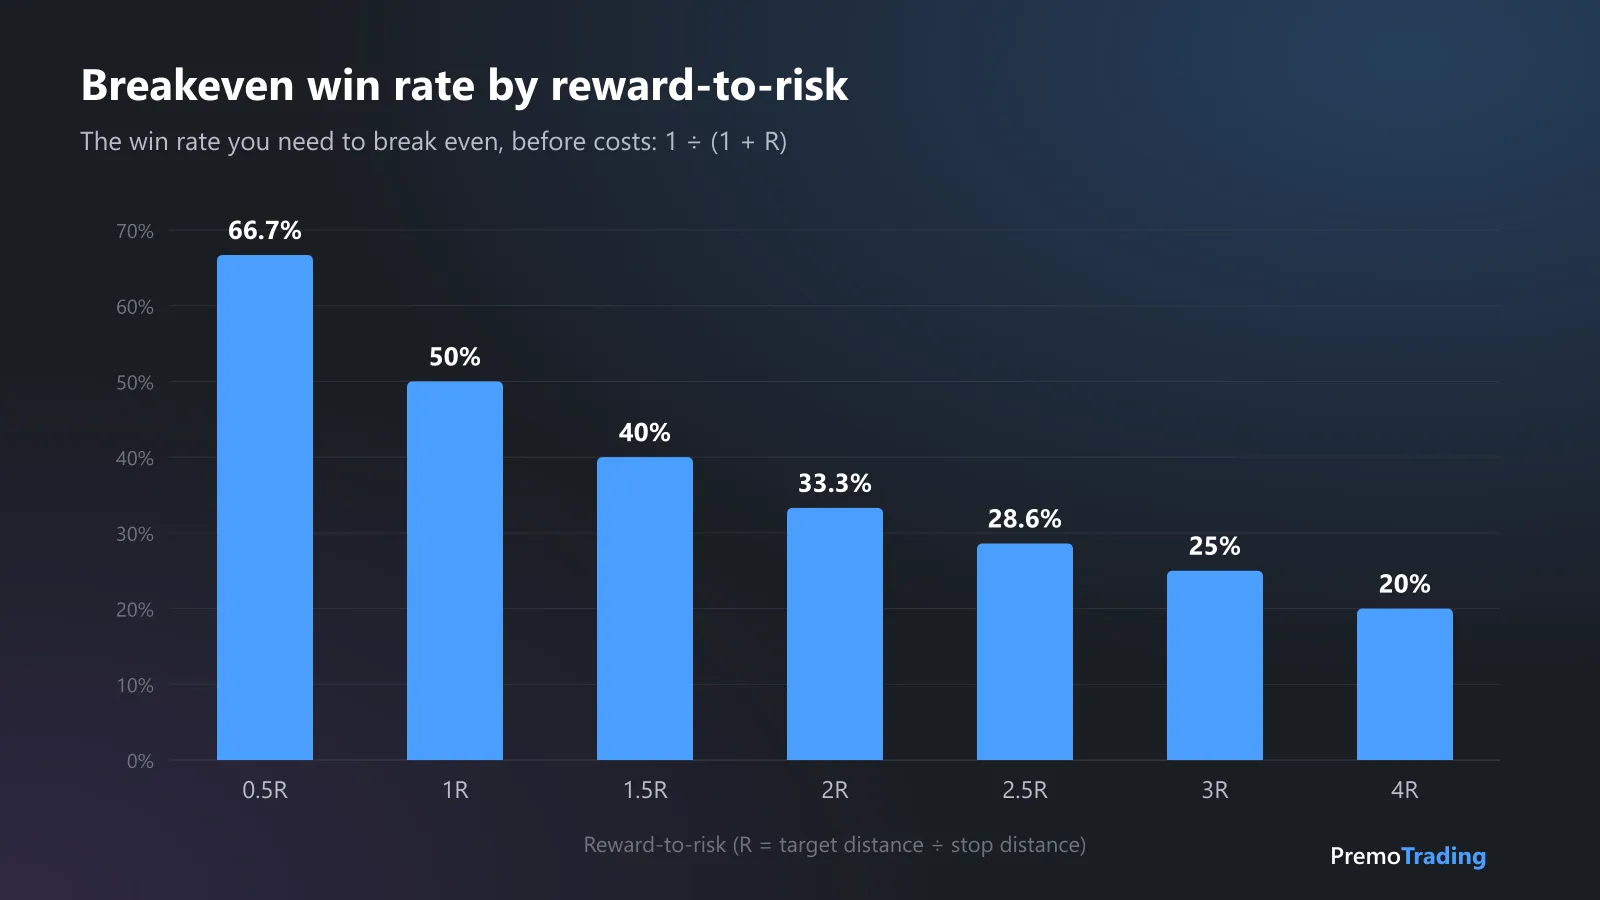
The breakeven win rate falls quickly as reward-to-risk rises - but so does the chance that price ever reaches a far target.
| Risk-reward | R | Breakeven win rate |
|---|---|---|
| 2:1 | 0.5 | 66.7% |
| 1:1 | 1 | 50.0% |
| 1:1.5 | 1.5 | 40.0% |
| 1:2 | 2 | 33.3% |
| 1:3 | 3 | 25.0% |
| 1:4 | 4 | 20.0% |
That last column is the trap. A 1:4 ratio needs only a 20% win rate, which sounds easy until you notice that a target four times further away than your stop gets hit far less often. Pushing targets out doesn’t create an edge by itself - it trades win rate for size of win.
To see the trade-off move, try the win rate vs R:R calculator: drag the two sliders and watch your strategy cross the breakeven line.
How costs move the breakeven
Every trade pays commissions and exchange fees whether it wins or loses. They come off your wins and add to your losses, so the real breakeven win rate is always a little higher than the table says.
Take the MNQ trade above and assume round-trip costs of $1.50 per contract (yours depend on your broker):
- Net win: $80 − $1.50 = $78.50
- Net loss: $40 + $1.50 = $41.50
- Breakeven win rate: 41.50 ÷ (41.50 + 78.50) = 34.6%, up from 33.3%
A 1.3-point difference looks small. Now scale it to a scalping strategy with a 6-point stop and a 6-point target on MNQ - $12 against $12 - and the same $1.50 moves breakeven from 50% to 56%. The smaller your trades, the more costs decide the outcome.
Planned R vs realized R
The ratio you set when you enter is a plan. What you actually earn is decided by how you exit, and most traders’ exits don’t match their plan:
- Taking profit early turns a planned 2R winner into a 0.8R winner.
- Moving the stop further away turns a planned 1R loss into a 1.6R loss.
- Moving the stop to break-even too soon turns potential winners into scratches.
The honest number is your realized reward-to-risk: your average win divided by your average loss, measured over your actual trades. That’s your realized R:R. If you plan 1:2 trades and your realized R:R is 1.1, your exits are costing you most of your edge.
Two numbers show where it leaks. MFE (how far price went your way) shows whether you are leaving moves on the table; MAE (how far it went against you) shows whether your stops are wider than your trades need. We explain both in What are MFE and MAE?.
Why risk-reward alone isn’t enough
The risk-reward ratio describes one side of the equation. Win rate describes the other. Neither tells you if a strategy works - you need both together, and that is exactly what expectancy measures:
Expectancy = (win rate × average win) − (loss rate × average loss)
A 1:3 strategy that wins 20% of the time loses money. A 1:1 strategy that wins 60% makes money. You can only tell by putting both numbers in the same formula, over enough trades to mean something. Our guide to expectancy in trading covers the formula and two worked examples.
Using R-multiples to measure your trades
Once you think in R, every trade can be measured the same way regardless of size or market:
- Your R is the dollar amount you risked: entry to stop, times position size.
- Each trade’s R-multiple is its result divided by R. Made $120 on a $40 risk? That’s +3R. Lost $60 on a $40 risk? That’s −1.5R - a sign the stop was moved or slipped.
- Your average R-multiple over many trades is your expectancy in R. Check it with your biggest trades left out too, as in Base hits or home runs?
Losses bigger than −1R are the first thing to look for. Each one is a trade where the plan said “lose one unit” and you lost more. Most come from a stop that was moved or skipped, often on tilt - see trading psychology.
How to choose your ratio
- Start from your setup, not a rule. Put the stop where the trade idea is proven wrong, and the target at a level price has reason to reach - a prior high, a gap, a liquidity level. The ratio is whatever those two levels give you.
- Skip trades that don’t pay. If the nearest sensible target is closer than your stop, the trade doesn’t have the reward to justify the risk.
- Check it against your win rate. Use the breakeven table. If your strategy wins 40% of the time, trades below 1:1.5 lose money.
- Measure, then adjust. After 50 to 100 trades, compare planned R with your realized R:R. Fix the exits before you touch the entries.
How Premo helps
Premo Trading calculates the numbers behind your real reward-to-risk from every closed position: average win, average loss, risk:reward (average win ÷ average loss), win rate and expectancy, after commissions and fees, for any day, week, month or year and any account or symbol. Excursion analysis adds MFE, MAE and efficiency, so you can see whether early exits or wide stops are shrinking your ratio.
The Edge tab puts your realized R:R and win rate on one map against the breakeven curve, with 1R as your average loss. It shows the R:R you’d need at your win rate to reach the next level of expectancy, and what capping your biggest losses would have done to your ratio.
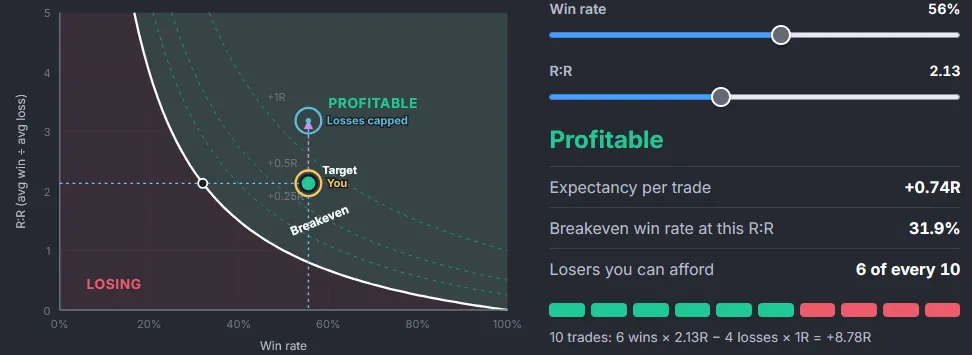
See it in Performance Analytics, or try the free win rate vs R:R calculator.
Sources
- Van K. Tharp, Trade Your Way to Financial Freedom, 2nd edition (McGraw-Hill, 2007): R-multiples and expectancy in R.
This article is educational and is not investment advice. Trading involves substantial risk of loss.
Frequently asked questions
What is a good risk-reward ratio?
There is no single good ratio, because it only means something next to your win rate. A 1:2 ratio needs a win rate above 33.3% to break even before costs, and a 1:1 ratio needs more than 50%. A good ratio is one your strategy can hit often enough to keep expectancy positive after fees.
How do you calculate the risk-reward ratio?
Divide the distance from your entry to your stop (the risk) by the distance from your entry to your target (the reward). A long entered at 100 with a stop at 98 and a target at 104 risks 2 to make 4, a risk-reward ratio of 1:2, or a reward-to-risk (R) of 2.
What win rate do you need for a 1:2 risk-reward ratio?
To break even before costs you need a win rate of 1 / (1 + 2) = 33.3%. Commissions and fees push it slightly higher. Anything above that, sustained over many trades, is positive expectancy.
Can you be profitable with a 1:1 risk-reward ratio?
Yes, if you win more than half of your trades after costs. Many scalping and mean-reversion strategies run close to 1:1 with high win rates. The ratio alone does not decide profitability - expectancy does.
What is the difference between planned and realized risk-reward?
The planned risk-reward ratio is set before the trade, from your stop and target. The realized ratio is measured after the fact: your average winning trade divided by your average losing trade. The gap between the two shows how well your exits follow your plan.
Is risk-reward ratio the same as R-multiple?
They are related. R is your initial risk on a trade. A trade's R-multiple is its result divided by that risk, so a trade that made twice what it risked is +2R. Reward-to-risk is the R-multiple you plan for if the target is hit.