
ICT trading concepts explained: liquidity, structure, time
ICT trading concepts explained: liquidity sweeps, market structure, order blocks, fair value gaps, premium and discount, kill zones, and how to test them.
ICT trading is a price-action method, taught by Michael J. Huddleston as the Inner Circle Trader, that reads a chart through three questions: where are the resting orders, what is the structure doing, and what time is it. Its named tools, such as order blocks, fair value gaps and kill zones, are ways of answering those questions.
ICT has more vocabulary than almost any other trading method, and that puts people off or sends them in circles. This guide sorts the main concepts into those three questions, shows what each one looks like on a chart, puts them together in one worked example, and ends with the part most guides skip: how to find out whether any of it works for you.
Key takeaways
- ICT is three questions: where is the liquidity, what is the structure doing, and what time is it.
- Liquidity means resting orders, mostly stops, above old highs and below old lows.
- A sweep followed by a fast move the other way is the event most ICT setups are built on.
- Order blocks, fair value gaps and the 62% to 79% zone are where ICT traders look for an entry on the way back.
- None of it is proven. It becomes testable when you write it as rules and count your own trades.
What is ICT trading?
ICT trading is a way of reading price as the footprint of large orders. The vocabulary spread through the teaching of Michael J. Huddleston, who publishes as The Inner Circle Trader, and it overlaps almost completely with what other traders call smart money concepts, or SMC.
The core idea is simple. Large orders need someone to trade against, and the most reliable place to find those counterparties is where other traders’ stops are resting. So price is drawn toward those stops, and what it does after reaching them tells you who is in control.
Two things are worth knowing before you learn the terms:
- It is discretionary. There are no fixed thresholds for most of the concepts, so two ICT traders can mark the same chart differently.
- The story is not the evidence. ICT material talks about institutions and algorithms. A chart can’t confirm who was behind a move. What you can check is whether a pattern, written as a rule, makes money in your own trades.
What are the main ICT concepts?
Each concept answers one of the three questions. This table is the map for the rest of the guide.
| Concept | What it is | Question it answers |
|---|---|---|
| Buy-side and sell-side liquidity | Resting orders above old highs and below old lows | Where is price likely to be drawn? |
| Liquidity sweep | A run through one of those levels that fails to hold | Was the level taken or broken? |
| Market structure | The sequence of swing highs and swing lows | Is the trend continuing or changing? |
| Displacement | A fast, one-sided run of large candles | Did the move have urgency behind it? |
| Fair value gap | A three-candle gap left by a fast move | Where might price return to? |
| Order block | The last opposing candle before a fast move | Where did the move start? |
| Premium and discount | The upper and lower halves of a range | Is this a cheap or an expensive price to enter? |
| Optimal trade entry | The 62% to 79% retracement of a move | How deep a pullback to wait for? |
| Kill zones | Set windows of the trading day | When is a setup worth taking? |
| Power of three | Accumulation, manipulation, distribution | How might the day or session unfold? |
What is liquidity in ICT?
Liquidity is where orders are resting, waiting to be triggered. Stops collect in obvious places, so those places can be marked in advance.
- Buy-side liquidity sits above old highs: the stops of traders who are short, and the entries of traders waiting to buy a breakout.
- Sell-side liquidity sits below old lows: the stops of traders who are long, and the entries of breakout sellers.
- Equal highs and equal lows are the most visible pools, because many traders put their stops just beyond the same level.
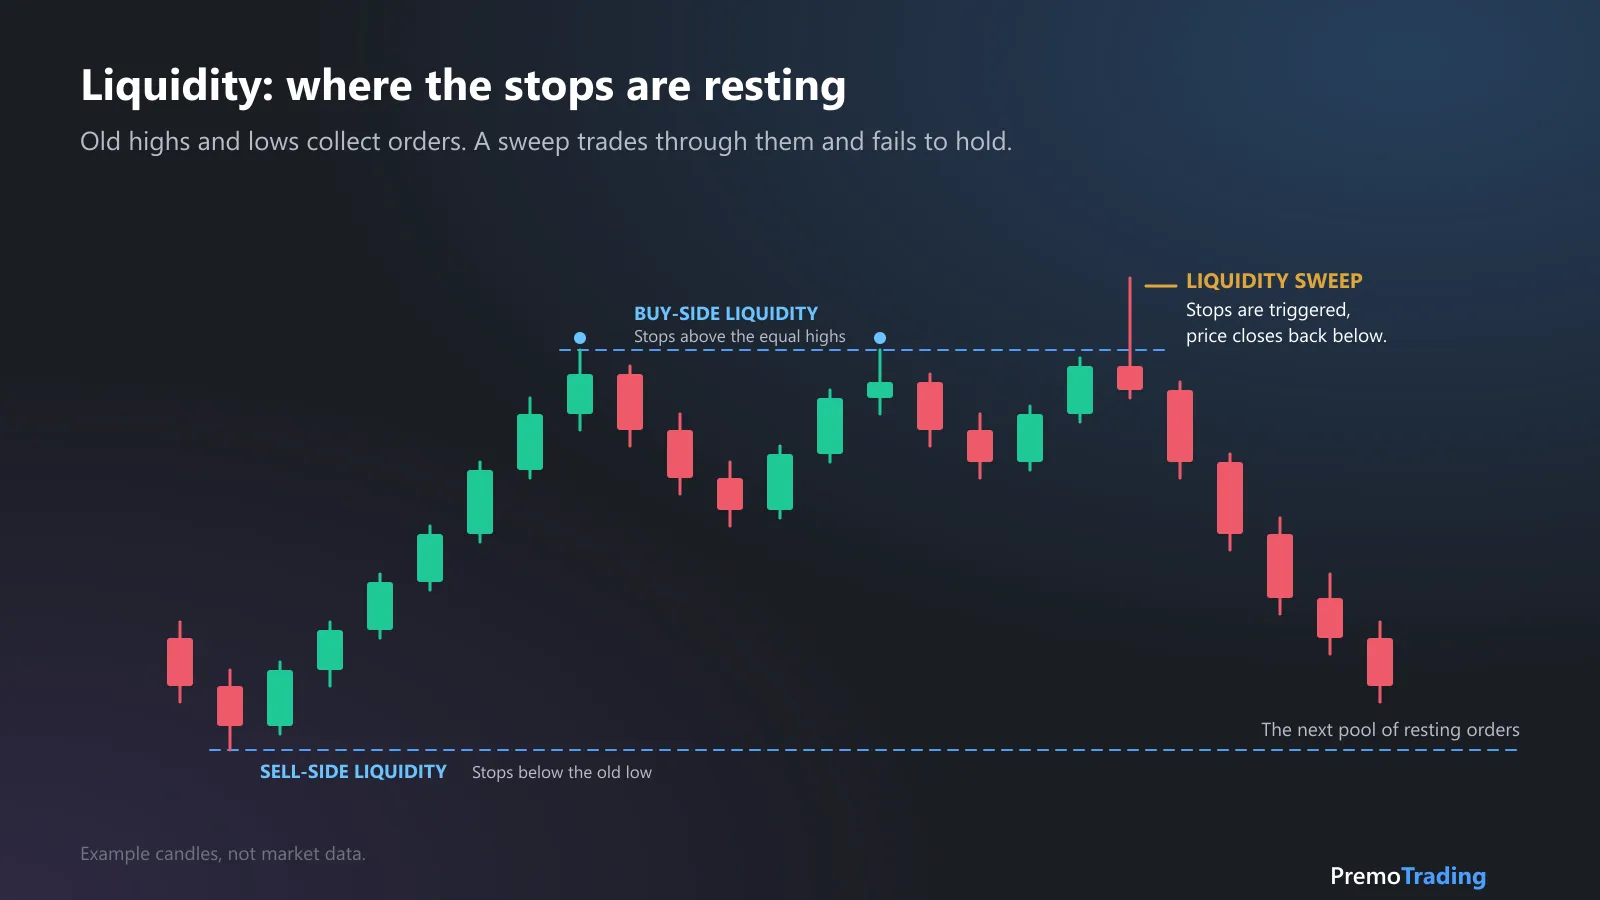
A sweep of buy-side liquidity. Price trades through the highs, triggers the stops and closes back inside.
When price reaches one of these pools, one of two things happens. It trades through and holds, which is a breakout. Or it trades through, fills the resting orders and comes back, which ICT traders call a liquidity sweep (also a stop run, a raid or a grab). The usual footprint is a wick beyond the level and a close back inside the old range.
That fork is the same one auction market theory describes at the edge of a range: acceptance or rejection. A sweep is what that theory calls a failed auction.
How does ICT read market structure?
ICT reads structure from swing highs and swing lows, and watches for the first break against the trend. Two labels matter most:
- Break of structure (BOS): price breaks a swing point in the direction of the trend. The trend continues.
- Change of character (CHoCH), or market structure shift: price breaks the most recent swing point against the trend. It’s the first sign the trend may be turning.
A break only counts for most ICT traders when it comes with displacement: a run of large candles closing the same way, covering ground quickly. A slow drift through a swing point is treated as noise. There’s no fixed measure of “large”, which is one of the places where judgment comes in.
Our guide to the ICT FVG reversal writes one structure setup out as rules, with the difference between BOS and CHoCH in detail.
What are order blocks and fair value gaps?
They are the two places ICT traders most often look for an entry when price comes back after a displacement.
- A fair value gap (FVG) is a three-candle pattern where the first and third candles don’t overlap, leaving a gap the middle candle crossed. Our fair value gap guide covers the types and how often they fill.
- An order block is the last candle that closed against the move before the move took off. Before a sharp rally, it’s the last down-closing candle. Before a sharp drop, it’s the last up-closing candle.
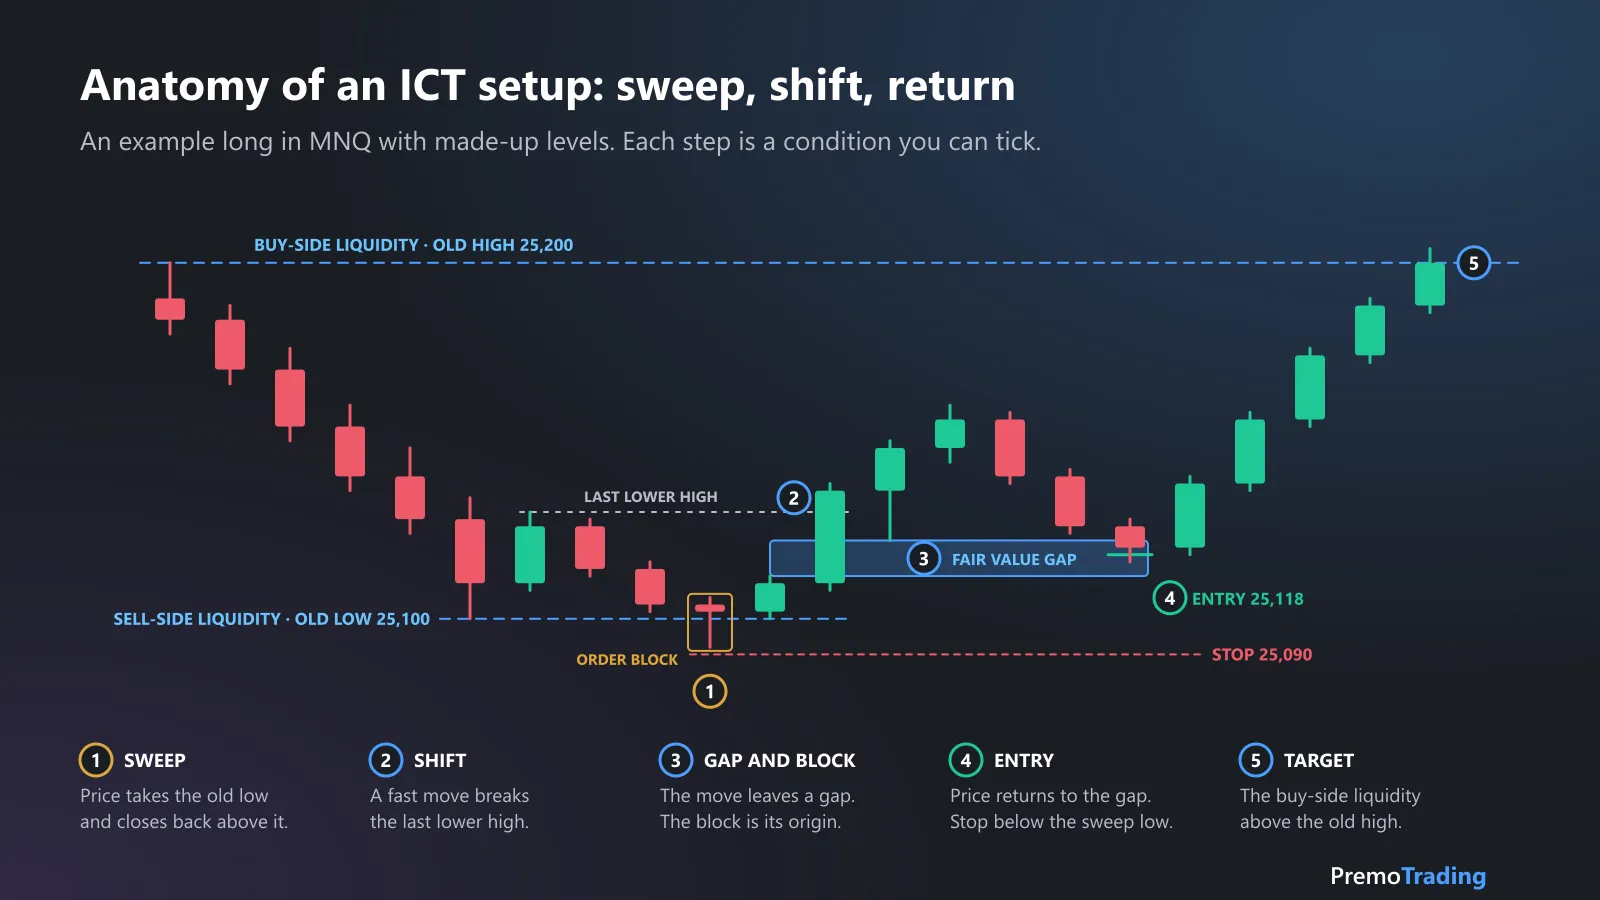
One sequence, five steps. Every level is known before the entry, so the trade can be checked afterwards.
Neither one is a signal by itself. An order block only earns the name if price left it with displacement, and plenty of gaps and blocks are traded straight through. Supply and demand traders will recognize the idea: an order block is close to what our guide to supply and demand trading calls the base of a zone.
What are premium, discount and optimal trade entry?
They describe where a price sits inside a range, so you buy low in the range and sell high in it.
Take the swing low and swing high of a move. The 50% level between them is equilibrium. Above it is premium, below it is discount. In ICT practice, longs are taken in discount and shorts in premium.
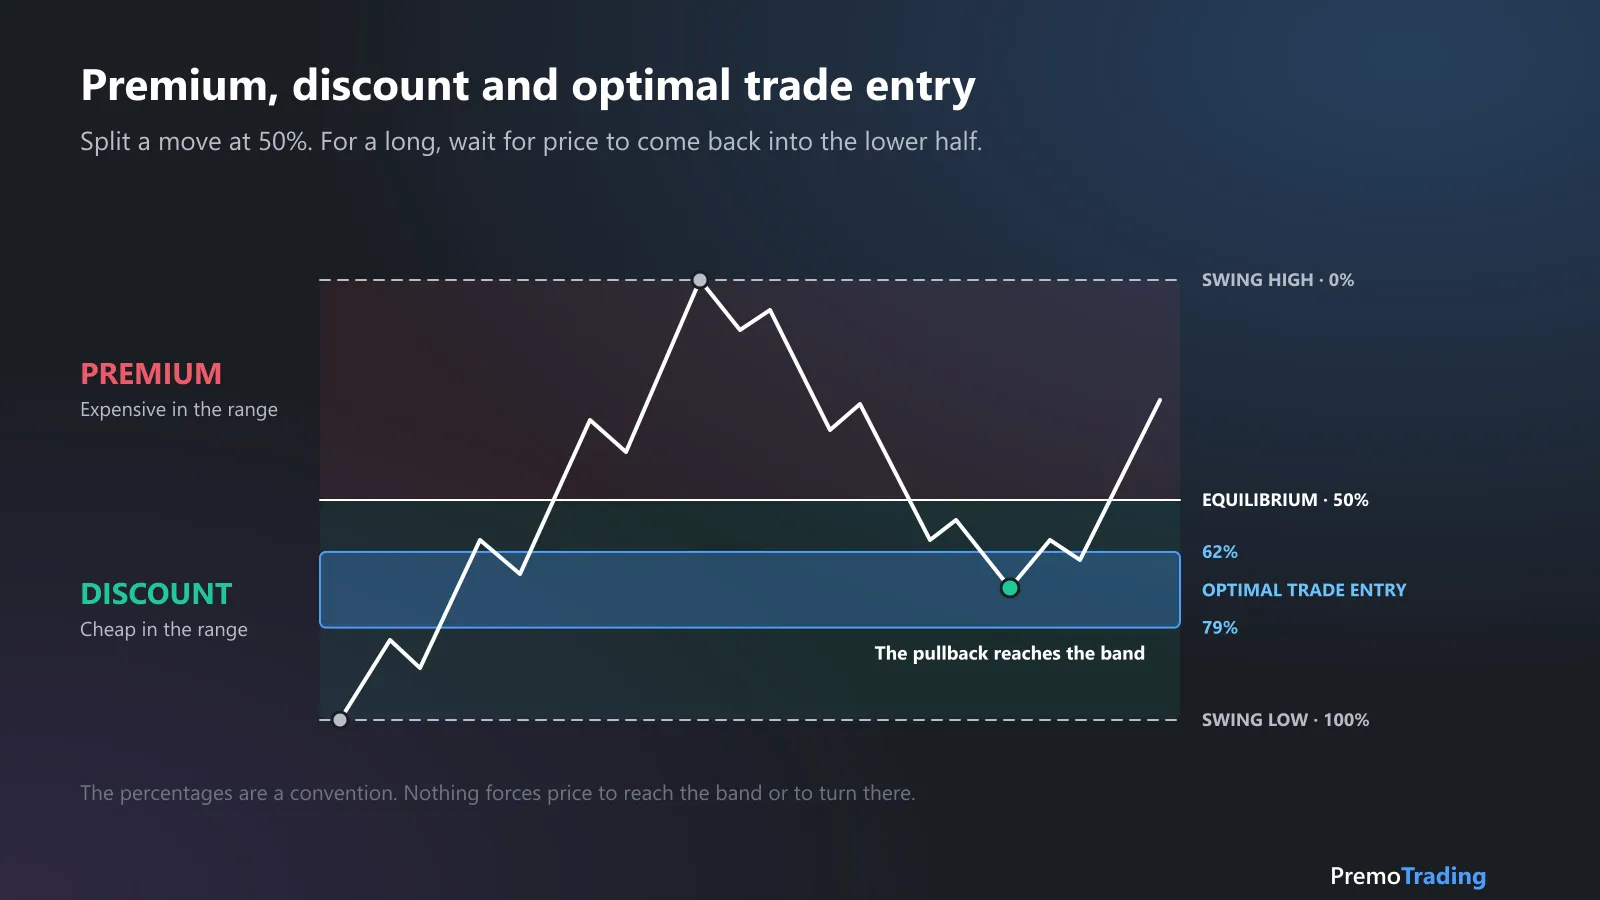
For a long, the optimal trade entry band sits deep in the discount half of the move.
Optimal trade entry (OTE) narrows that down to a band: the retracement between about 62% and 79% of the move, with the midpoint at 70.5%. It’s deep enough to keep the stop close and early enough that most of the move is still ahead. The percentages are a convention. Nothing forces price to reach the band or to turn there.
When do ICT traders trade?
Inside set windows of the day called kill zones. ICT treats time as a filter: the same pattern is given more weight when it forms in one of these windows than in the quiet hours between them.
| Kill zone | New York time | What ICT traders expect |
|---|---|---|
| Asia | About 8:00 to 10:00 p.m. | A range that later sessions trade back to |
| London open | 2:00 to 5:00 a.m. | Often the high or low of the day |
| New York morning | 7:00 to 10:00 a.m. (8:30 to 11:00 a.m. for index futures) | The day’s main move, or a reversal of London’s |
| London close | 10:00 a.m. to noon | A pullback against the morning’s move |
| New York afternoon | 1:30 to 4:00 p.m. | A last push into the close |
The times are the set most often quoted, taken here from LuxAlgo’s library, which notes that sources differ by 30 to 90 minutes. Treat the edges as soft.
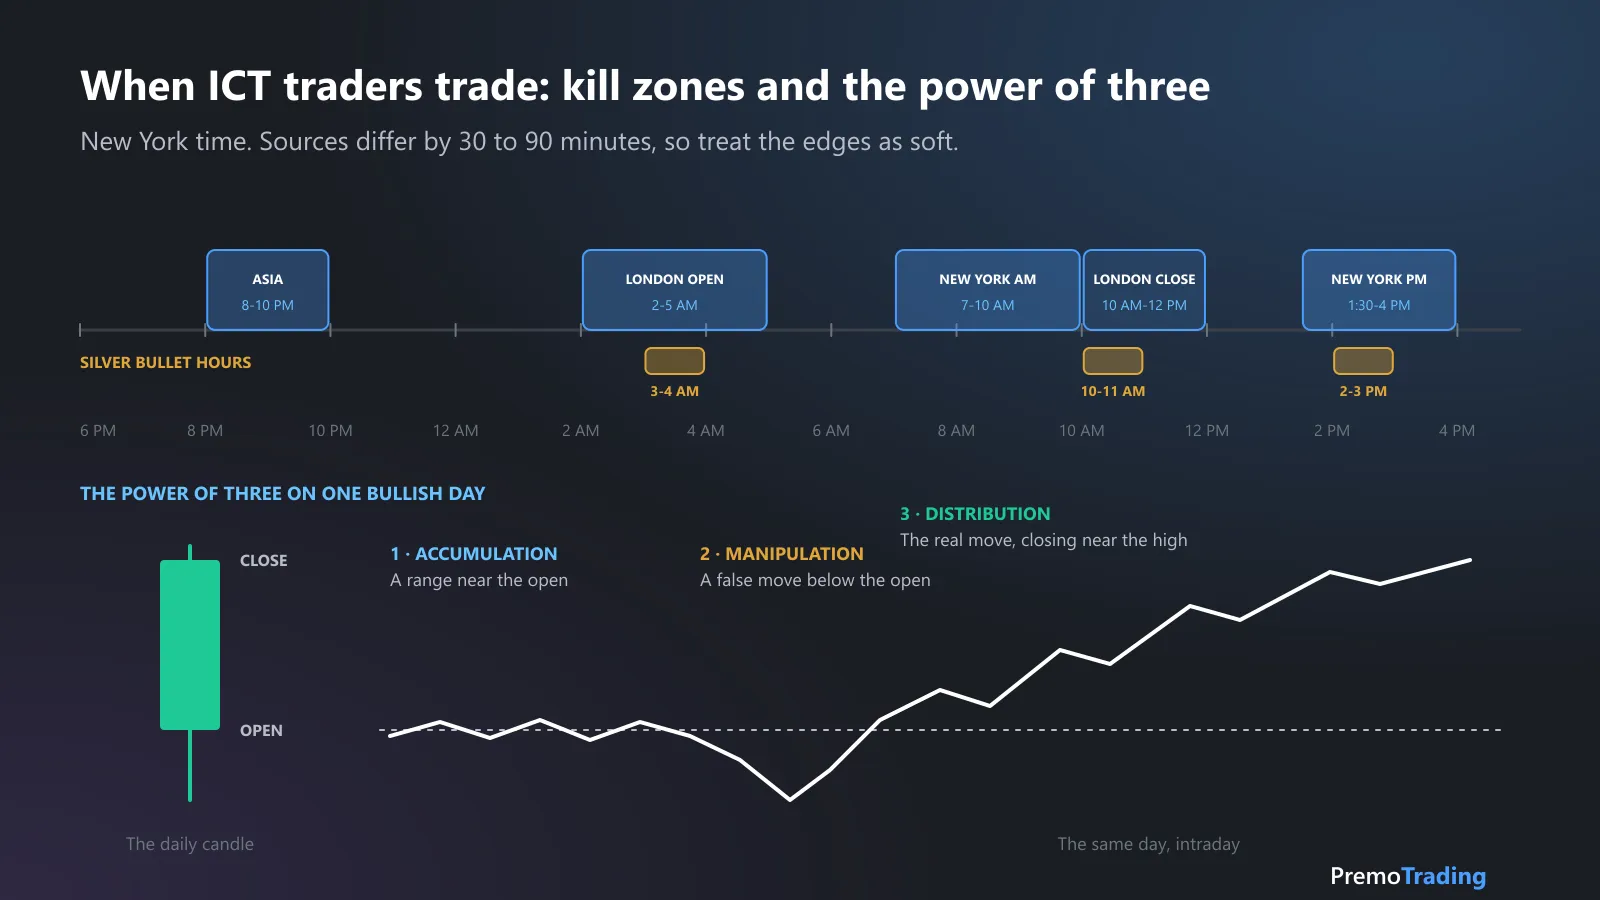
The kill zones in New York time, the three Silver Bullet hours, and the power of three on one bullish daily candle.
Two named ideas sit on top of the clock:
- The Silver Bullet is a one-hour window, at 3 to 4 a.m., 10 to 11 a.m. or 2 to 3 p.m. New York time, in which the trader looks for one setup: a sweep or structure shift, then an entry in a fair value gap that forms inside the hour. No gap in the window means no trade.
- The power of three (accumulation, manipulation, distribution) is a template for a day or session. Price builds a range near the open, makes a false move through one side of it, then travels the other way. It’s easy to see on a finished candle and much harder in real time, and many days trend from the open with no false move at all.
How do the concepts fit into one trade?
They chain into a sequence: liquidity is taken, structure shifts with displacement, and the entry comes on the way back. Written as steps, a long looks like this:
- Mark the liquidity on both sides: the old low that could be swept and the old high that could be the target.
- Wait for the sweep. Price trades below the old low and closes back above it.
- Wait for the shift. Price breaks the most recent lower high with displacement.
- Mark the entry zone: a fair value gap or order block inside the move, in the discount half.
- Enter on the retracement, with the stop below the low of the sweep.
- Target the opposing liquidity, above the old high.
A worked example in MNQ
This is an illustration with made-up levels, not a recommendation. MNQ is worth $2 a point.
Say the overnight low is 25,100 and the overnight high is 25,200. In the New York morning, price trades down to 25,092 and closes back above 25,100. It then runs up to 25,160, breaking the last lower high on the way and leaving a fair value gap between 25,112 and 25,122.
| Level | Why | |
|---|---|---|
| Sweep low | 25,092 | 8 points below the overnight low |
| Top of the move | 25,160 | 68 points above the sweep low |
| Equilibrium | 25,126 | Half of the 68-point move |
| OTE band | 25,106.25 to 25,118 | The 79% and 62% retracements |
| Fair value gap | 25,112 to 25,122 | In discount, overlapping the OTE band |
| Entry | 25,118 | Where the gap and the band overlap |
| Stop | 25,090 | 2 points below the sweep low: 28 points, $56 |
| Target | 25,200 | The overnight high: 82 points, $164, 2.9R |
On one contract the trade risks $56 to make $164. At 2.9R it breaks even, before costs, at a win rate of about 25%. You can try other numbers in the win rate vs risk-reward calculator.
The example has six conditions. That’s the strength of the method and its weakness: every condition is a reason to say the trade was “almost” valid. Decide before the session which ones are required.
How does ICT compare with auction market theory and classic technical analysis?
Much of ICT renames events that other schools already describe. The words differ more than the chart does.
| What happens on the chart | ICT | Auction market theory | Classic technical analysis |
|---|---|---|---|
| Price pokes through a level and comes back | Liquidity sweep | Failed auction, rejection | False breakout |
| A fast one-way move | Displacement | Initiative activity, imbalance | Breakout, momentum |
| A zone price crossed quickly | Fair value gap | Low-volume area | Gap |
| The origin of a strong move | Order block | The edge of prior value | Support or resistance, supply or demand zone |
| The upper and lower half of a range | Premium and discount | Above and below value | Top and bottom of the range |
These are rough equivalents, not identical definitions. The useful point is that you don’t have to pick a school. You have to pick rules, and then find out whether they pay.
Does ICT trading work?
Nobody can show that it does in general, and nobody can show that it doesn’t. What you can say honestly is narrower.
- There’s no audited record. We found no audited public statistics for ICT’s models. LuxAlgo’s library says the same of the Silver Bullet and calls the win rates quoted online marketing until shown otherwise.
- The definitions are loose. Displacement has no threshold, kill zone times vary by source, and traders disagree on what counts as a sweep.
- Hindsight flatters it. Every finished chart has a sweep and a gap somewhere. Finding them afterwards is not the same as trading them live.
- The observation underneath is ordinary. Stops do collect at obvious levels, and activity does cluster around session opens. That makes the ideas plausible. It doesn’t make them an edge.
So the honest answer isn’t a verdict. It’s a test.
How do you test ICT concepts on your own trades?
Write one setup as rules, tag every trade, and count. It takes a few weeks of trades, not a belief.
- Write the setup. Use the six steps above and mark which conditions are required. Our guide to trading setups shows how to write one so it can be ticked off.
- Tag each trade with the conditions that were really there: sweep, structure shift, displacement, gap or order block, discount, kill zone.
- Record the time of the entry. Then compare your results inside and outside the kill zones you trade.
- After 50 or more trades, compare: expectancy with every condition present against expectancy with one missing, and planned R against realized R.
If the trades with all six conditions don’t beat the rest, the extra conditions aren’t adding anything. If trades outside your kill zone do just as well, the clock isn’t your filter. Either result tells you something no course can.
How Premo helps
Premo Trading doesn’t mark liquidity, gaps or order blocks on a chart. You do that on your charting platform, and Premo measures what you did with it:
- Write the setup in the Playbook. Fair value gap, Order block and Market structure are among the standard confluences, and you can add your own, such as “Liquidity sweep” or “Inside the New York kill zone”. Mark the ones the setup can’t do without as Required.
- Review each trade against it. Tick the confluences that were really there and any warning signs, compare planned R with realized R and grade your execution. Each reviewed trade gets a Gate Pass and a Confidence score out of 100.
- See the setup’s own statistics: trades, win rate, expectancy and average R.
- Check the clock. The trade journal breaks your results down by hour of the day, with wins, losses and average P&L for each, so you can see whether your kill zone hours are your best ones.
Sources
- The Inner Circle Trader on YouTube: Michael J. Huddleston’s own channel, the primary source for the method.
- LuxAlgo Library, read November 18, 2026: Smart Money Concepts / ICT, killzones, Silver Bullet, liquidity sweep, buy-side liquidity, order block, displacement, optimal trade entry and accumulation, manipulation, distribution. Kill zone times, Silver Bullet windows and the 62% to 79% band follow these pages.
- CME Group: Micro E-mini Nasdaq-100 futures: MNQ is $2 times the Nasdaq-100 index.
This article is educational and is not investment advice. The levels, trades and figures shown are examples, not recommendations, forecasts or actual results. Trading futures involves substantial risk of loss.
Frequently asked questions
What is ICT trading?
ICT trading is a price-action method taught by Michael J. Huddleston under the name Inner Circle Trader. It reads a chart by asking where resting orders sit (liquidity), what the swing structure is doing, and what time of day it is, using tools such as order blocks, fair value gaps and kill zones.
What does ICT stand for in trading?
ICT stands for Inner Circle Trader, the name Michael J. Huddleston teaches under. In trading conversations the letters refer both to him and to the body of concepts he popularized, such as liquidity sweeps, order blocks, fair value gaps, premium and discount, and kill zones.
What are ICT kill zones?
Kill zones are windows of the day when ICT traders expect the cleanest moves. In New York time the commonly quoted set is Asia from 8 to 10 p.m., London open from 2 to 5 a.m., New York morning from 7 to 10 a.m., London close from 10 a.m. to noon, and New York afternoon from 1:30 to 4 p.m.
What is an order block in ICT?
An order block is the last candle that closed against a move before the move took off: the last down-closing candle before a sharp rally, or the last up-closing candle before a sharp drop. ICT traders treat it as a zone price may react to on a return.
Is ICT the same as smart money concepts?
Nearly. Smart money concepts, or SMC, is the wider name for reading price as the footprint of large orders, and most of its vocabulary was popularized by ICT. Traders use the two names almost interchangeably, though ICT also includes time-based ideas such as kill zones and the Silver Bullet.
Is ICT trading profitable?
Nobody can show that it is in general. We found no audited public statistics for ICT's models, and win rates quoted online are not evidence. ICT is a discretionary method, so results depend on your rules and execution. The only reliable answer comes from your own journal after 50 or more trades.