
Auction market theory explained: balance and imbalance
Auction market theory explained: how a market moves between balance and imbalance, what the value area tells you, and how to test each regime in your journal.
Auction market theory (AMT) is a way of reading a market as a continuous two-way auction that searches for the prices where the most business gets done. The market alternates between balance, where price rotates around accepted value, and imbalance, where it leaves to find a new one. Knowing the regime tells you which kind of trade fits.
A strategy is a set of rules. Auction market theory is the step before the rules: a description of what the market is doing right now, so you can tell whether your rules belong in it. This guide covers where the theory comes from, how to read value, how to tell balance from imbalance, what happens at the edge of a range, and how to test all of it against your own trades.
Key takeaways
- A market is always in one of two regimes: balance, where it rotates, or imbalance, where it travels.
- Value is where volume accepted price. The value area and point of control mark it.
- Fading the edge fits balance. Going with the move fits imbalance. Most painful trades are the right idea in the wrong regime.
- The edge of a range has two outcomes, rejection or acceptance, and time and volume tell them apart.
- It’s a framework, not a forecast. Tag each trade with the regime and let your own numbers judge it.
What is auction market theory?
Auction market theory treats every market as an auction whose job is to find the prices where buyers and sellers will do business. Price moves up until buyers stop lifting it, down until sellers stop pressing it, and it spends the most time and volume at the prices both sides accept.
The idea grew out of the Market Profile, which J. Peter Steidlmayer presented through the Chicago Board of Trade in 1985 as a way to show what a market is doing while it trades. Donald L. Jones, writing for CISCO Futures in 2009, described the approach this way: value is the primary variable for describing a market, even though price is what you observe. The best-known books on the method are Mind Over Markets and Markets in Profile: Profiting from the Auction Process by James Dalton, Eric Jones and Robert Dalton.
Three ideas carry most of the theory:
- Price advertises. A move to a new price is an offer, and the market finds out who responds to it.
- Time and volume decide. Prices where a lot of volume traded were accepted. Prices that were visited briefly were rejected.
- Value moves more slowly than price. Price can leave value in minutes. Value only moves when volume builds at the new prices.
How do you read value on a chart?
You read value from a volume profile: a histogram on the price axis that shows how much traded at each price. Three levels do most of the work.
| Level | What it is | What it tells you |
|---|---|---|
| Point of control (POC) | The price with the most volume | The price the market agreed on most |
| Value area | The range that holds a chosen share of the volume, usually 70% | Where price was accepted |
| Value area high and low (VAH, VAL) | The top and bottom of the value area | The edges where acceptance ran out |
The 70% is a convention, and charting platforms let you change it. TradingView’s documentation describes it as the typical setting. It echoes the share of a bell curve that sits within one standard deviation of the middle, which is about 68%.
Two more terms help. A high-volume node is a price zone with a lot of volume, where price tends to slow down. A low-volume node is a thin zone that price crossed quickly, and tends to cross quickly again. Our guide to order flow trading covers session profiles and their shapes in more detail.
What are balance and imbalance?
Balance is a market that agrees on value and rotates around it. Imbalance is a market that has left the old value and is traveling to find a new one. Every chart, on every timeframe, is doing one or the other.
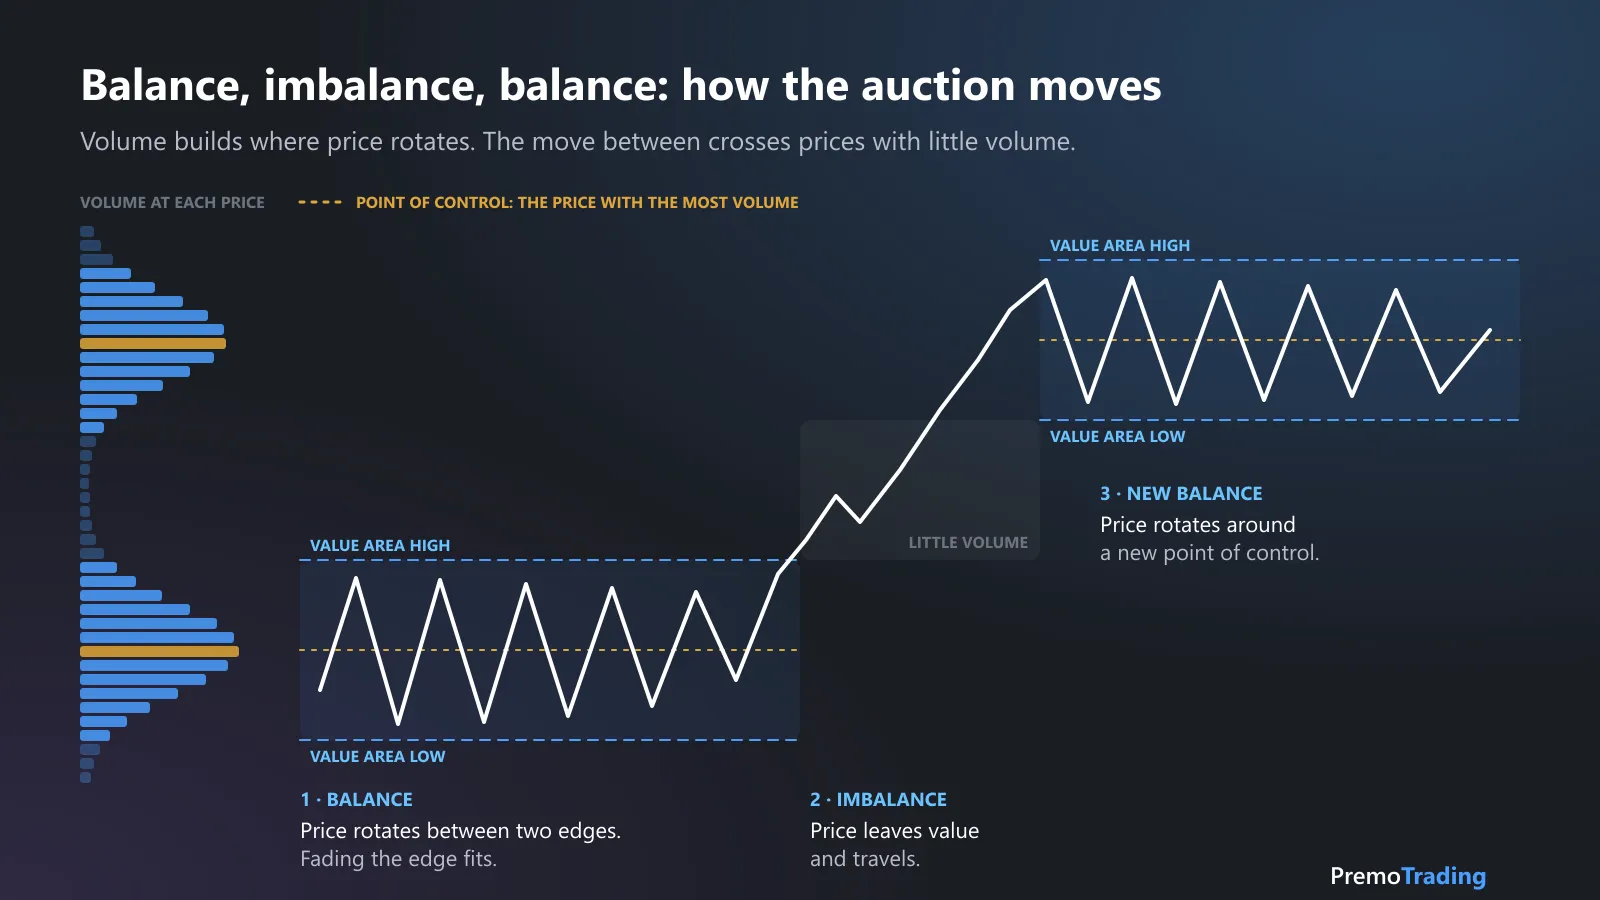
Balance builds volume. Imbalance crosses prices with little volume. Then the market balances again.
| Balance | Imbalance | |
|---|---|---|
| What price does | Rotates between two edges | Travels in one direction |
| Profile shape | Wide, with one clear point of control | Thin and stretched, with the point of control moving |
| Value areas, day to day | Overlap | Step higher or lower |
| Trade that fits | Fade the edge, back toward the point of control | Go with the move after it’s accepted |
| Where the trade can go | The point of control, or the far edge | The next area of accepted value |
| What ends it | Price is accepted outside the range | Price starts to rotate and volume builds |
Balance isn’t wasted time. It’s where both sides build positions, and the stops and orders that collect at the edges are part of what moves price when one side finally gives way. A move out of balance often comes with new information, such as an economic release or earnings, but the chart shows you the acceptance whether or not you know the reason.
One note on vocabulary: in ICT material, an “imbalance” usually means a fair value gap, a three-candle price gap. In auction market theory, imbalance is the regime, not a single gap on the chart.
What are initiative and responsive activity?
They are the two directions a trade can take relative to value. Responsive activity trades back toward value. Initiative activity trades away from it.
| Above the value area | Below the value area | |
|---|---|---|
| Responsive | Selling: price is high relative to value | Buying: price is low relative to value |
| Initiative | Buying: accepting higher prices | Selling: accepting lower prices |
In a balanced market, responsive traders are the ones getting paid, because price keeps returning to value. In an imbalanced market, initiative traders are, because value is following price. The same sell at the same price can be a sound fade one day and a fight with a trend the next. The regime is what changed.
How can you tell which regime the market is in?
Compare where price is trading with where value was, and watch what happens at the edges. Here’s a routine you can run before and during a session. The thresholds are examples: set your own and write them down.
- Mark the prior session’s value area: VAH, POC and VAL.
- Note where today opens. An open inside the prior value area makes balance the default. An open outside it means the market is already testing new prices.
- Line up the last few sessions. Overlapping value areas are balance on a larger scale. Value areas that step higher or lower are imbalance.
- Watch the first test of an edge. A quick return inside is rejection. Time and volume building outside is acceptance. One example rule: two 30-minute periods in a row that trade and close outside the value area.
- Check the point of control. If today’s POC is forming outside the prior value area, value is moving.
- Write the regime down before your first trade, along with what would prove you wrong.
Step 6 matters more than it looks. A regime call written before the session can be checked afterwards. One made in hindsight is always right.
What happens at the edge of a range?
One of two things: the market rejects the new prices and rotates back, or it accepts them and moves on. This is where a balance either continues or ends, so it’s where most of the decisions in auction market theory get made.
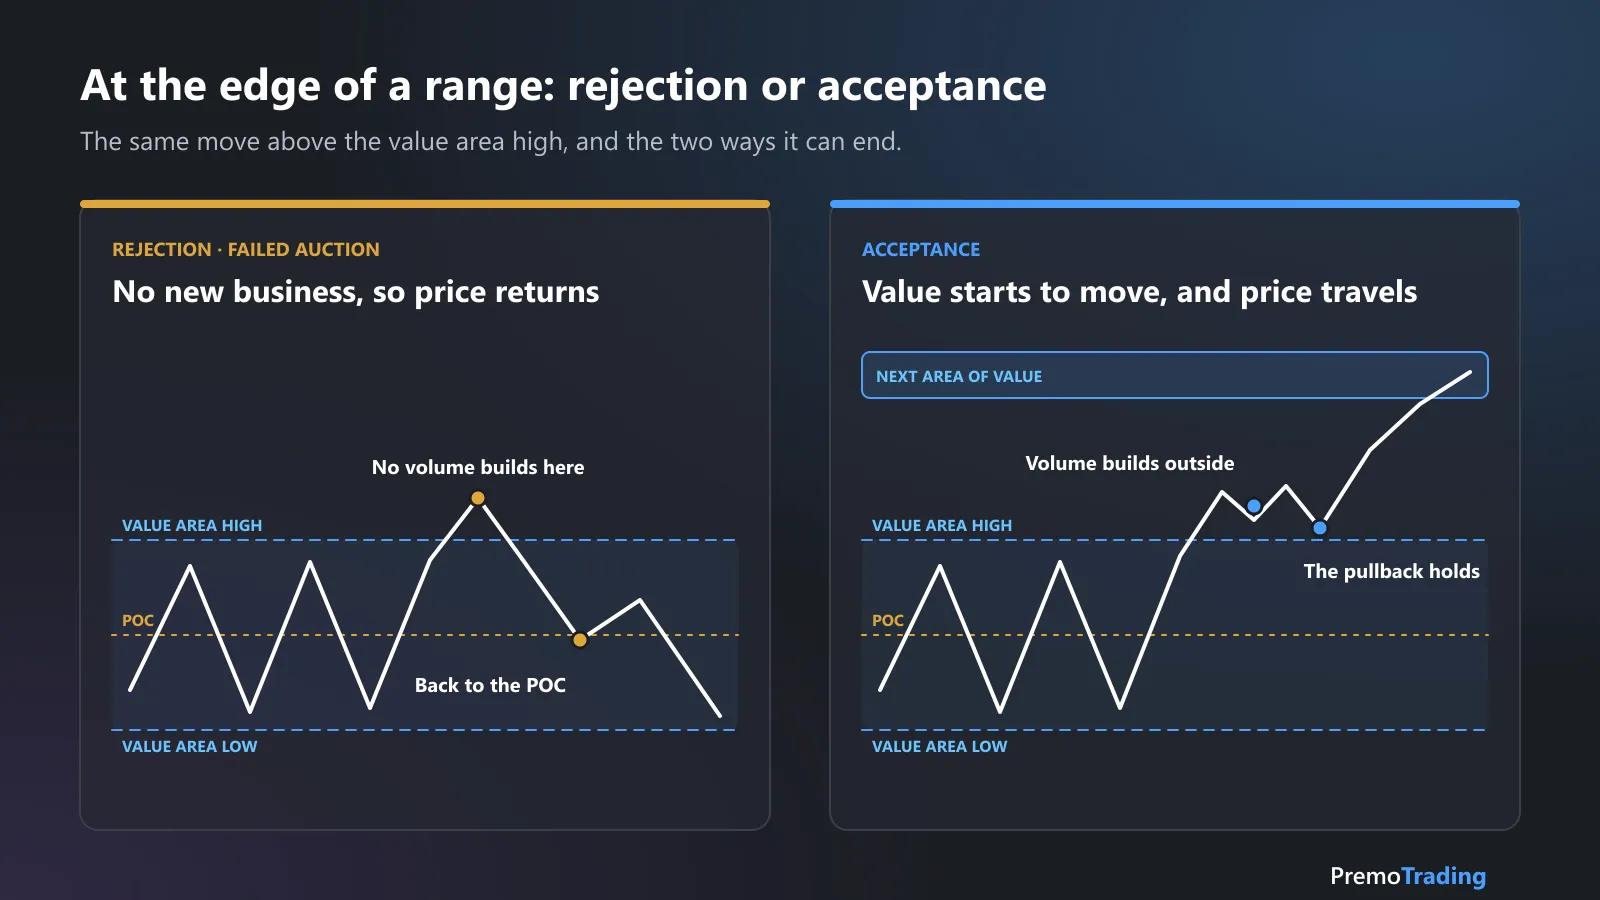
The same breakout, two endings. Time and volume outside the range tell them apart.
- Rejection, or a failed auction. Price trades beyond the edge, little volume builds there, and it returns inside. The auction advertised higher prices and found no takers. The usual path is back toward the POC, and sometimes to the opposite edge.
- Acceptance. Price trades beyond the edge and stays. Volume builds, the developing POC moves, and a pullback to the old edge holds. Value has started to move, and price can travel until it finds the next zone where volume traded before.
A worked example in MNQ
This is an illustration with made-up levels, not a recommendation. Say the prior session’s value area in MNQ ran from 25,040 (VAL) to 25,120 (VAH), with the POC at 25,080, and the next area of accepted value above starts at 25,230. MNQ is worth $2 a point, and both trades use a 20-point stop, so 1R is $40 on one contract.
| Fade after a rejection | Continuation after acceptance | |
|---|---|---|
| Regime | Balance | Imbalance |
| Entry | Short 25,115, back inside value | Long 25,125, on a pullback that holds above value |
| Stop | 25,135: 20 points, $40 | 25,105: 20 points, $40 |
| Where it can go | POC at 25,080: 35 points, $70, 1.75R | Next value at 25,230: 105 points, $210, 5.25R |
| What caps it | The far edge at 25,040: 75 points, 3.75R | The next area of accepted value |
| Break-even win rate, before costs | 36% | 16% |
| It’s wrong when | Price is accepted above 25,120 | Price is accepted back inside value |
Two things stand out. In balance, the reward has a ceiling: the far edge of the range, however good the entry. In imbalance, the target is the next area of value, which can be several times the risk. That doesn’t make the second trade better. It wins less often, and many sessions stay in balance and never offer it. The break-even figures come from 1 ÷ (1 + R), which you can try with other numbers in the win rate vs risk-reward calculator.
The costly trades are the mismatches: holding a fade for 5R inside a range that is only 80 points wide, or fading an edge again and again after the market has accepted prices beyond it.
What are the limits of auction market theory?
It describes; it doesn’t predict. Jones puts it plainly in the same paper: in markets, “the complexity precludes true forecasting”. The theory gives you information to decide with, not an answer.
- It’s partly subjective. Two traders can draw different ranges and call different regimes on the same chart.
- The levels depend on the tool. A value area built from time at price (Market Profile) and one built from volume at price (volume profile) can differ, and so can the session you measure.
- One session is thin evidence. A single day’s profile can mislead, which is why step 3 lines up several.
- Regimes are only obvious afterwards. At the edge, in real time, rejection and acceptance look alike for a while.
- Nobody can tell you it’s profitable for you. That depends on your setups, your execution and your costs.
How do you test auction market theory on your own trades?
Add two tags to every trade and count them. The tags take ten seconds, and after 50 or more trades they show whether reading the regime helps you.
- Regime at the entry: balance or imbalance, as you called it before the trade.
- Trade type: responsive (toward value) or initiative (away from value).
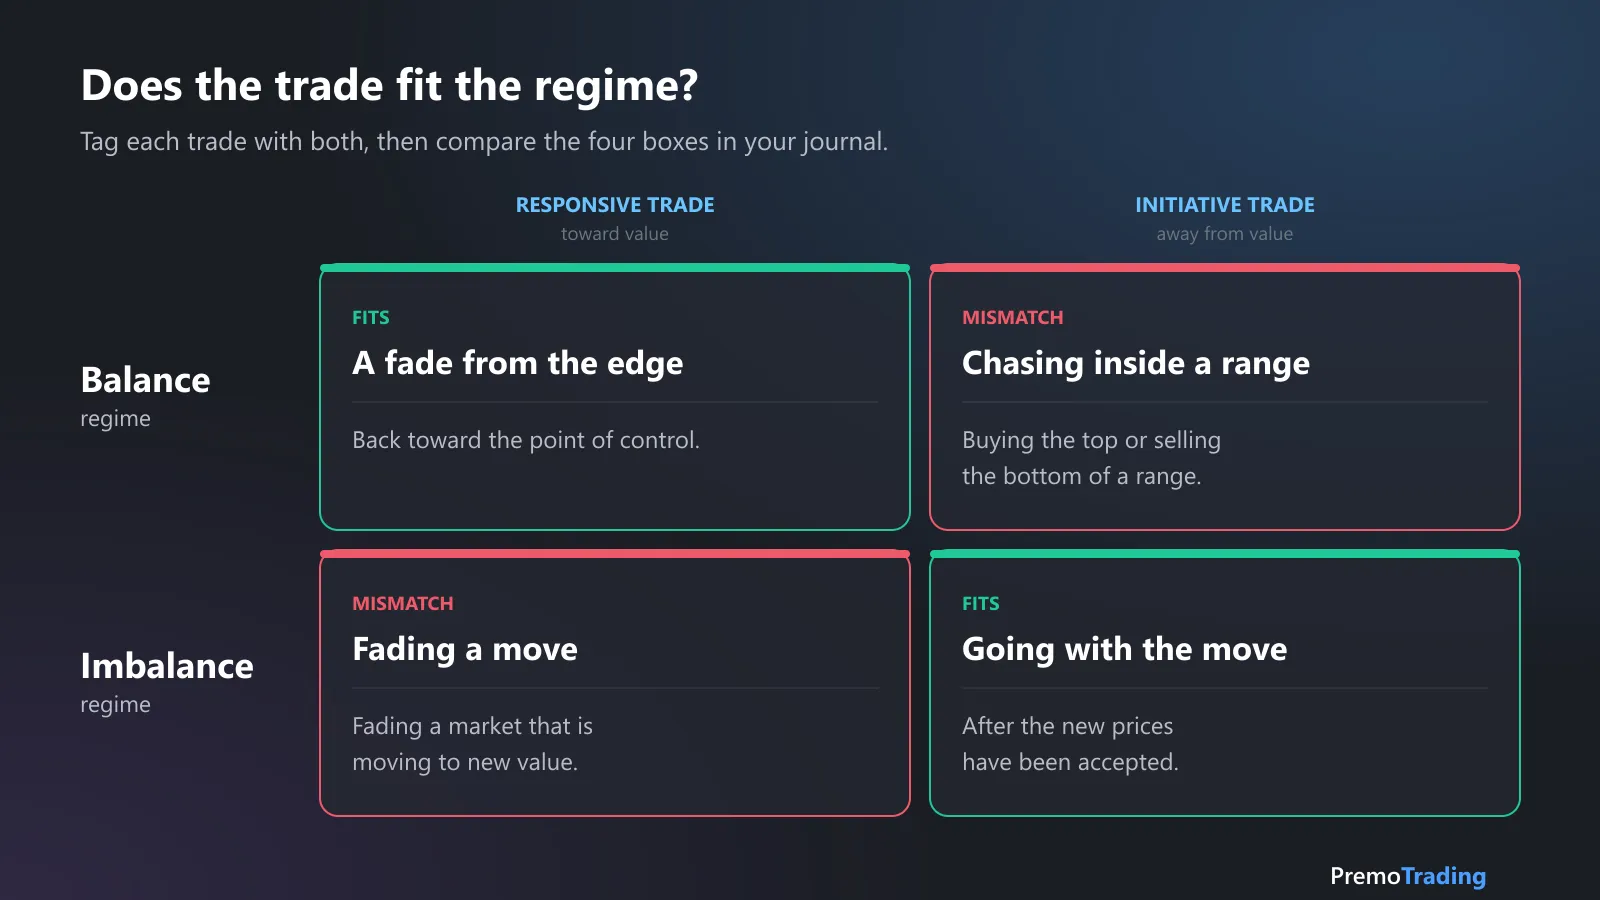
Four kinds of trade. Two fit the regime and two fight it.
Then count four things:
- Expectancy for each of the four boxes. If your mismatched trades lose and your matched trades don’t, the framework is earning its place. Our guide to expectancy shows the calculation.
- How often your regime call was right. Compare the call you wrote before the session with what the session did.
- Planned R against realized R, split by regime. Taking 1R out of an imbalance move that offered 5R is its own leak.
- Results by setup. Write one setup for balance and one for imbalance, each with its own conditions, and compare them.
If the numbers show no difference, that’s a finding too: this isn’t your edge, and you’ve saved yourself months of drawing profiles.
How Premo helps
Premo Trading doesn’t draw volume profiles. You read the auction on your charting platform, and Premo measures what you did with that read:
- Write one setup per regime in the Playbook, for example “Balance: fade the value edge” and “Imbalance: continuation after acceptance”. Add your own confluences, such as “Opened inside prior value” or “Accepted above VAH”, and mark the ones each setup can’t do without as Required.
- Review each trade against its setup. Tick the confluences that were really there and any warning signs, compare planned R with realized R and grade your execution. Each reviewed trade gets a Gate Pass and a Confidence score out of 100.
- See each setup’s own statistics: trades, win rate, expectancy and average R on its card, and every figure on Trader Summary filtered to that setup.
- Import the trades from your broker or platform export through one of the integrations, so the prices, fees and P&L aren’t typed by hand.
Sources
- Jones, D. L. (2009), Auction Market Theory, CISCO Futures, archived copy. Read November 17, 2026.
- Dalton, J. F., Jones, E. T. and Dalton, R. B. (2013), Mind Over Markets: Power Trading with Market Generated Information, Updated Edition, Wiley.
- Dalton, J. F., Dalton, R. B. and Jones, E. T. (2007), Markets in Profile: Profiting from the Auction Process, Wiley.
- TradingView Help Center: Volume profile indicators, basic concepts: point of control, value area and the typical 70% setting. Read November 17, 2026.
- CME Group: Micro E-mini Nasdaq-100 futures: MNQ is $2 times the Nasdaq-100 index.
This article is educational and is not investment advice. The levels, trades and figures shown are examples, not recommendations, forecasts or actual results. Trading futures involves substantial risk of loss.
Frequently asked questions
What is auction market theory in trading?
Auction market theory is a way of reading a market as a continuous two-way auction that searches for the prices where the most business gets done. It describes two regimes: balance, where price rotates around an accepted value, and imbalance, where price leaves that value to find a new one.
What is the difference between balance and imbalance?
In balance, buyers and sellers agree on value, so price rotates between two edges and the volume profile is wide with one clear point of control. In imbalance, one side is more aggressive, price travels in one direction through prices with little volume, and the value area moves with it.
What is the value area in auction market theory?
The value area is the range of prices where a chosen share of a session's volume traded, usually 70%. Its top is the value area high, its bottom is the value area low, and the price with the most volume inside it is the point of control. It marks where the market accepted price.
What is the difference between initiative and responsive activity?
Responsive activity trades back toward value: selling above the value area or buying below it. Initiative activity trades away from value: buying above the value area or selling below it. Responsive trades tend to fit a balanced market, and initiative trades tend to fit an imbalanced one.
Is auction market theory a trading strategy?
No. It is a framework for describing what the market is doing, not a set of entry and exit rules, and it does not forecast. You still need a written setup with a trigger, a stop and a target, and enough of your own trades to see whether that setup has positive expectancy.
What is a failed auction?
A failed auction is a move beyond the edge of a balance range that finds no new business and returns inside it. Price trades outside value for a short time, volume does not build there, and the market rotates back, often toward the point of control or the opposite edge.