
Order flow trading: session profiles, CVD and GEX
Why order flow matters and how to read it: session volume profiles, POC and value area, cumulative volume delta (CVD) divergences, and GEX levels.
Order flow is the buying and selling that actually happens in the market: aggressive orders taking the liquidity resting in their way. Price moves when one side uses up the orders on the other. A candlestick shows you the result of that fight. Order flow shows you who was fighting, where, and whether they’re winning.
Most traders learn from price charts first, and price charts are a summary. A green candle could be strong buying, or it could be sellers stepping away. A breakout could be the start of a trend, or a burst of buying into a seller who absorbs all of it and turns price back. The candle looks the same. The order flow doesn’t.
This guide covers why order flow matters, and three layers you can read: session profiles for where volume traded, cumulative volume delta (CVD) for who was aggressive, and gamma exposure (GEX) for where dealers will have to hedge next. You can start with the first two for free. The third is what turns order flow from a record of the past into a map of what’s likely to come.
Key takeaways
- Order flow shows the cause; candles show the effect. It tells real moves from absorption.
- Futures are well suited to it, because CME futures trade on one exchange with a complete record of volume.
- Session profiles show where the market did business: the point of control and the value area.
- CVD shows whether buyers or sellers were aggressive - and divergences show when they’re running out.
- GEX looks forward. It shows where dealer hedging will add to or absorb moves before price gets there.
Why order flow matters
Every trade has a buyer and a seller, but only one of them is in a hurry. The aggressor sends a market order and accepts the current price; the passive side rests a limit order and waits. When aggressive buyers outnumber the sellers resting above them, price rises. When resting sellers absorb all of it, price stalls, however strong the buying.
Reading that tells you things a price chart can’t:
- Whether a breakout has fuel. A breakout on strong aggressive buying is different from a breakout on thin volume.
- Absorption. Heavy buying that doesn’t move price means a large seller is filling it - often a sign of a turn.
- Exhaustion. Price makes a new high, but with less aggressive buying than the last one.
- Where the market did business, and therefore where it’s likely to react when price returns.
Why futures are a good fit
US stocks trade on more than a dozen exchanges plus off-exchange venues, so no single feed sees everything at once. CME equity index futures trade on one exchange, Globex, so the volume record for MNQ or ES is complete. That makes order flow tools on futures more reliable than the same tools on fragmented stock data.
Layer 1: session profiles
A session volume profile turns the session’s volume sideways: instead of volume per bar, it shows volume at each price. Four parts matter:
- Point of control (POC): the price with the most volume.
- Value area: the range around the POC that holds about 70% of the session’s volume.
- Value area high and low (VAH / VAL): the top and bottom of that range.
- High- and low-volume nodes: prices with heavy volume (where the market accepted price) and thin volume (where it moved through quickly).
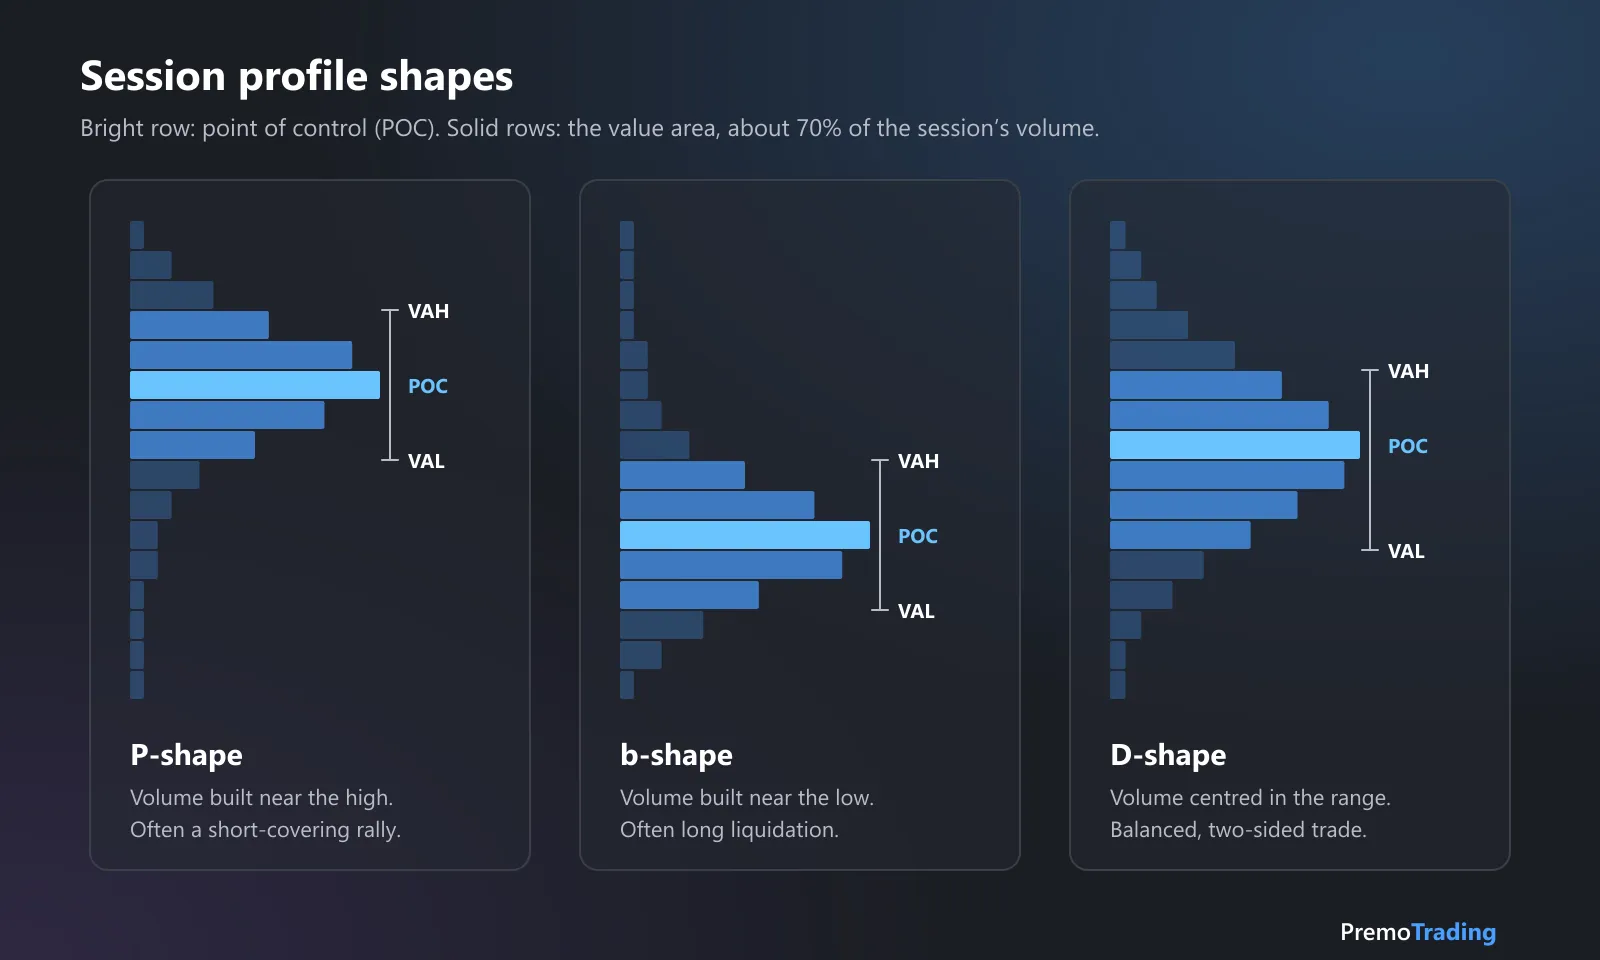
The shape of a session’s profile is a summary of who was in control. P-shapes often come from short covering, b-shapes from long liquidation, and D-shapes from a balanced, two-sided day.
How traders use session profiles
- The prior session’s value area is the first reference for today. Opening inside it suggests balance; opening outside it suggests the market is looking for new value.
- The prior POC often acts as a magnet when price returns to it.
- Low-volume nodes tend to be passed through quickly - the profile equivalent of a fair value gap.
- Overnight vs regular session. On MNQ, many traders keep separate profiles for the overnight (Globex) session and the regular 9:30 a.m. to 4:00 p.m. ET session, because volume in each is very different.
Volume profile has a cousin, market profile (TPO), which counts time at each price instead of volume. They usually agree, but volume profile reflects actual participation.
Layer 2: cumulative volume delta (CVD)
Delta is the volume traded at the ask minus the volume traded at the bid in a bar - aggressive buying minus aggressive selling. Cumulative volume delta adds it up through the session into a single line.
- Rising CVD: buyers have been the aggressors.
- Falling CVD: sellers have been the aggressors.
- CVD and price moving together: the move is supported by aggression on the same side.
CVD divergences
The most useful signal is when the two disagree:
| Price | CVD | What it suggests |
|---|---|---|
| New high | Lower high | Buying aggression is fading - exhaustion, or a seller absorbing it |
| New low | Higher low | Selling aggression is fading - exhaustion, or a buyer absorbing it |
| Flat | Rising strongly | Aggressive buying is being absorbed by a passive seller |
| Flat | Falling strongly | Aggressive selling is being absorbed by a passive buyer |
A divergence isn’t an entry by itself. It’s a warning that the move you are watching is running on less than it seems - most useful when it appears at a level that already matters.
CVD’s limits
- It depends on the data. True delta needs tick-level data marking which side was the aggressor. Some platforms estimate it from bar data instead, which is only an approximation.
- It resets each session on most platforms, so the same move looks different depending on where the reset falls.
- Absolute levels mean little. A CVD of +5,000 isn’t “bullish”; the direction and divergences carry the information.
Layer 3: GEX - where dealers will have to hedge
Session profiles and CVD have one thing in common: they describe what has already happened. Gamma exposure (GEX) is different. It’s built from options open interest, and it estimates the hedging dealers will have to do as price moves - before price gets there.
Three outputs matter most for order flow traders:
- Zero gamma (the gamma flip). Above it, dealer hedging tends to absorb moves - more two-sided trade, more absorption at levels. Below it, hedging tends to add to moves - more one-sided aggression and fewer reversals.
- The call wall - a level where dealer selling tends to increase as price approaches, often a ceiling.
- The put wall - a level where hedging often provides support in positive gamma, and can accelerate a break in negative gamma.
In other words, GEX tells you in advance where the absorption and exhaustion you would see on CVD are most likely to appear, and what kind of day it’s likely to be. Our guide to gamma exposure (GEX) explains how it’s calculated, and quad witching covers how it changes around expiration.
Putting the three together: an example on MNQ
A morning session on MNQ, with illustrative levels:
- Before the open. The prior session’s value area low (VAL) is at 25,010. The GEX profile, mapped to MNQ, puts the put wall at 25,000, and price is above zero gamma - a positive gamma day, where dealers tend to absorb moves.
- The test. Price sells off into 25,005, just above the put wall and below the prior VAL.
- The divergence. Price makes a lower low, but CVD makes a higher low - selling aggression is fading, and something is absorbing it.
- The trade. A long as price reclaims the prior VAL at 25,010, with the stop below the put wall at 24,990 and a first target at the prior session’s POC.
- Where it’s wrong. A close below the put wall, with CVD making new lows, means the level has failed and the regime may be changing.
Three independent reads - where the market did business, who was aggressive, and where dealers must hedge - agree on one level. That’s the point of the layers: none of them is a signal on its own, but together they tell you which levels are worth your risk. For a similar idea with price-based zones, see supply and demand trading.
If you don’t have GEX
You can start with session profiles and CVD today. Both are built into charting platforms such as TradingView (availability depends on your plan), and together they cover the past half of the picture: where volume traded and who was pushing.
What you miss without GEX is the forward-looking half: where hedging flows will be concentrated, and whether today is a day for fading moves or respecting them. You’ll find the same levels eventually, after price reacts to them. With GEX, they’re on your chart before the open.
Order flow, then your own data
Order flow tells you where and how. It doesn’t tell you whether you trade those levels profitably. Record your trades at profile levels, CVD divergences and GEX levels, and after 50 or more, compare their expectancy with the rest of your trading. Our guide to expectancy shows how to read the number.
How Premo helps
Premo Trading’s pre-market routine for futures includes reviewing the overnight range, liquidity zones and volume profile across timeframes. Members of GEX & Strike Profiles add the positioning layer: gamma exposure built from open interest, split by expiration and mapped from SPX to MNQ - zero gamma, call and put walls, max pain and the expected move - exported to TradingView as a Pine Script, so it sits next to your session profile and CVD.
This article is educational and is not investment advice. Gamma exposure is a model of dealer positioning and does not predict prices. Trading involves substantial risk of loss.
Frequently asked questions
What is order flow trading?
Order flow trading reads the buying and selling that actually happens - which side is aggressive, where volume trades and where large orders sit - instead of relying only on the shape of the price chart. The goal is to see who is driving a move and whether it is likely to continue.
What is CVD in trading?
CVD stands for cumulative volume delta. Delta is the volume traded at the ask (aggressive buying) minus the volume traded at the bid (aggressive selling). CVD adds that delta up through the session, so a rising line means buyers have been more aggressive and a falling one means sellers have.
What is the point of control (POC)?
The point of control is the price where the most volume traded in a session or range. It marks the price the market spent most of its business at, and it often acts as a magnet or a pivot when price returns to it.
What is the difference between volume profile and market profile?
Volume profile shows how much volume traded at each price. Market profile (TPO) shows how much time price spent at each price, in 30-minute periods. They often agree, but volume profile reflects actual participation while market profile reflects time.
Do you need Level 2 data for order flow trading?
No. Session profiles and CVD are built from trade data - what actually traded and at which side - and are available on many charting platforms. Level 2 and the depth of market show resting orders, which adds detail but also noise, since orders can be pulled before they trade.
Is GEX a type of order flow?
GEX isn't order flow in the strict sense, because it is modeled from options open interest rather than read from trades. But it estimates future order flow: the hedging dealers must do as price moves. That is why it works as a forward-looking layer next to session profiles and CVD.