
Fair value gap (FVG): what it is and how to trade it
Fair value gaps explained: bullish and bearish FVGs, inversion FVGs, the 50% consequent encroachment level, which gaps matter, and how to trade one on MNQ.
A fair value gap (FVG) is a three-candle pattern where price moves so quickly that the first and third candles never overlap. In a bullish fair value gap, the third candle’s low sits above the first candle’s high. The empty space between them is a range the market passed through with little trading in both directions - and price often comes back to it.
The term comes from ICT (Inner Circle Trader) concepts, but the idea is older and simpler than its following suggests: a fast, one-sided move leaves an imbalance behind, and the market tends to revisit imbalances. The hard part isn’t spotting gaps - every chart is full of them. It’s knowing which ones matter and what to do when price returns.
This guide covers how to identify bullish and bearish gaps, inversion gaps, the 50% level, which gaps are worth trading, and an intraday example on MNQ.
Key takeaways
- Bullish FVG: candle 3’s low is above candle 1’s high. Bearish FVG: candle 3’s high is below candle 1’s low.
- The 50% level - consequent encroachment - is the reference point for entries and for judging whether a gap holds.
- An inversion FVG is a gap price closes through; on the retest it often works from the other side.
- Filter gaps by width, age and whether they formed on a move that broke structure.
- Fair value gaps don’t always fill. Measure the ones you trade before you trust them.
How to identify a fair value gap
Look at any three candles in a row:
- Bullish fair value gap: candle 3’s low is above candle 1’s high. The gap runs from candle 1’s high up to candle 3’s low.
- Bearish fair value gap: candle 3’s high is below candle 1’s low. The gap runs from candle 3’s high up to candle 1’s low.
Candle 2 is almost always a large-bodied candle - the impulse. Its wicks are irrelevant to the definition; only candles 1 and 3 matter.
ICT material often uses two acronyms for the same patterns: BISI (buy-side imbalance, sell-side inefficiency) for a bullish gap and SIBI (sell-side imbalance, buy-side inefficiency) for a bearish one.
Why fair value gaps form
Price moves when one side of the market overwhelms the other. In a sharp rally, buyers take every offer in their way, so price skips through a range almost without any selling. That range has been traded through, but barely traded in.
When the urgency fades, price often drifts back into that range - to fill orders that were never filled, or because the traders who missed the move are waiting there. That’s the logic behind trading the return to a gap. It’s a tendency, not a law.
Fair value gap vs imbalance vs gap
| Term | What it is |
|---|---|
| Price gap | A jump between one bar’s close and the next bar’s open - most often between sessions |
| Fair value gap | Three candles where the wicks of candles 1 and 3 don’t overlap |
| Volume imbalance (ICT) | Two candles whose bodies don’t overlap, while their wicks do |
| Opening gap (ICT: NDOG / NWOG) | The gap between one day’s or week’s close and the next open |
Consequent encroachment: the 50% level
The midpoint of a gap - (top + bottom) ÷ 2 - is called consequent encroachment (CE). It’s the level most traders watch, for two reasons:
- As an entry. Entering at the top of the gap fills more often but at a worse price; waiting for the bottom gives a better price but misses more trades. The midpoint is the usual compromise.
- As a test. How price behaves at 50% tells you whether the gap is still being respected.
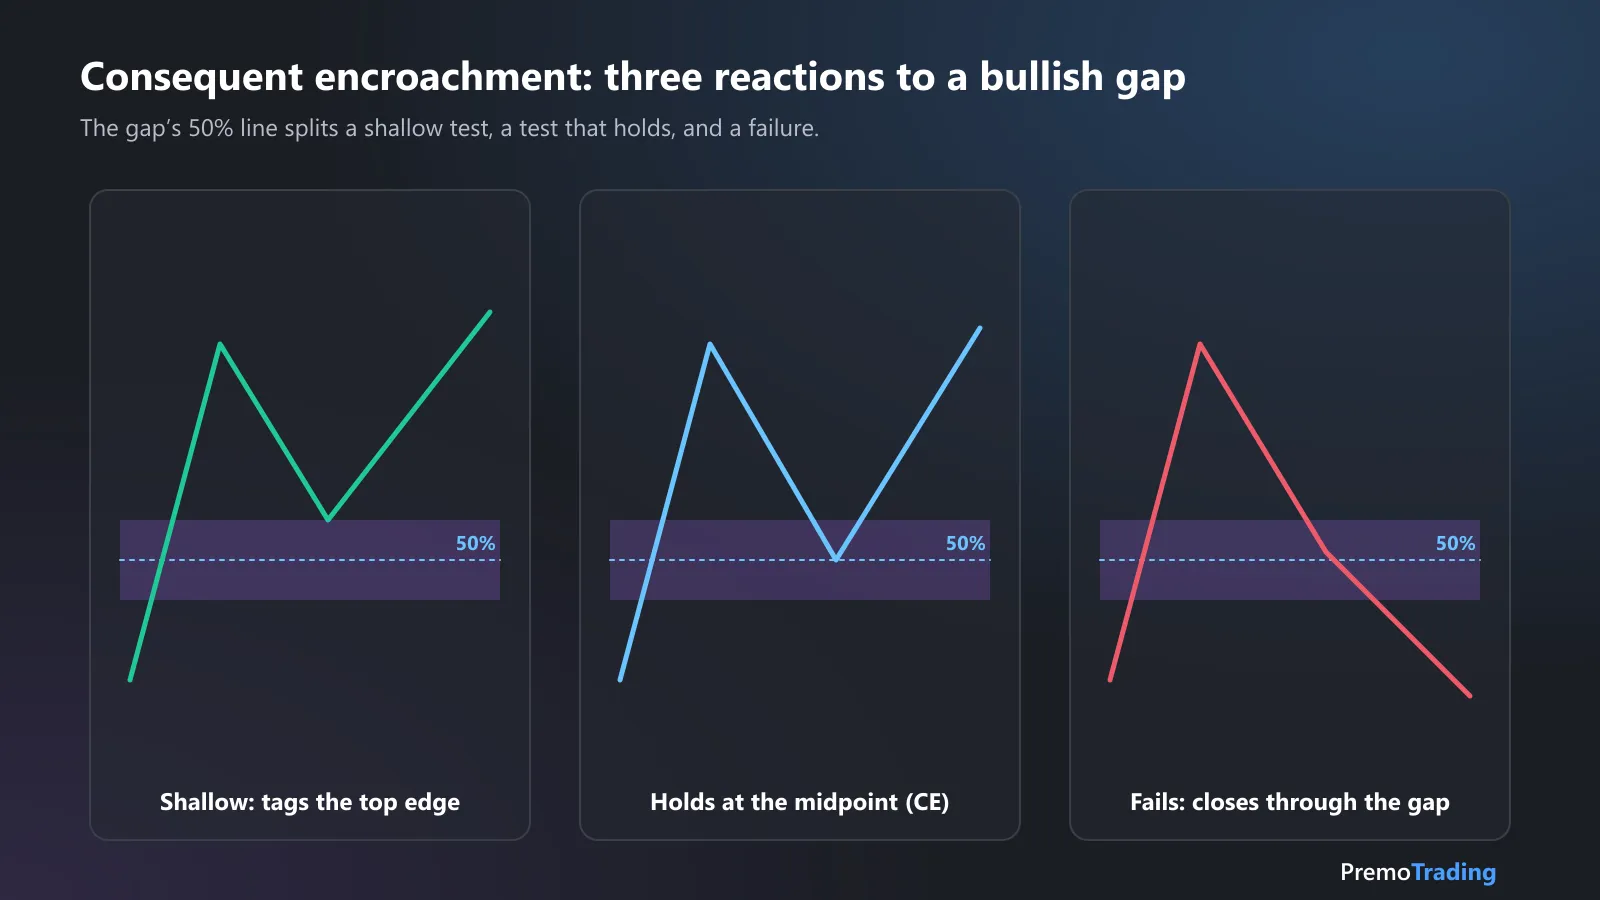
A shallow test shows strong demand. A hold at the midpoint is the classic reaction. A close through the whole gap means it has failed - and may become an inversion gap.
For a complete strategy that enters at a gap’s midpoint after a change in trend structure, see our ICT FVG reversal guide.
Inversion fair value gaps
Sometimes price doesn’t respect a gap - it closes straight through it. That gap is now an inversion fair value gap (IFVG), and it often works from the other side:
- A bearish gap that price closes above can act as support on the retest.
- A bullish gap that price closes below can act as resistance on the retest.
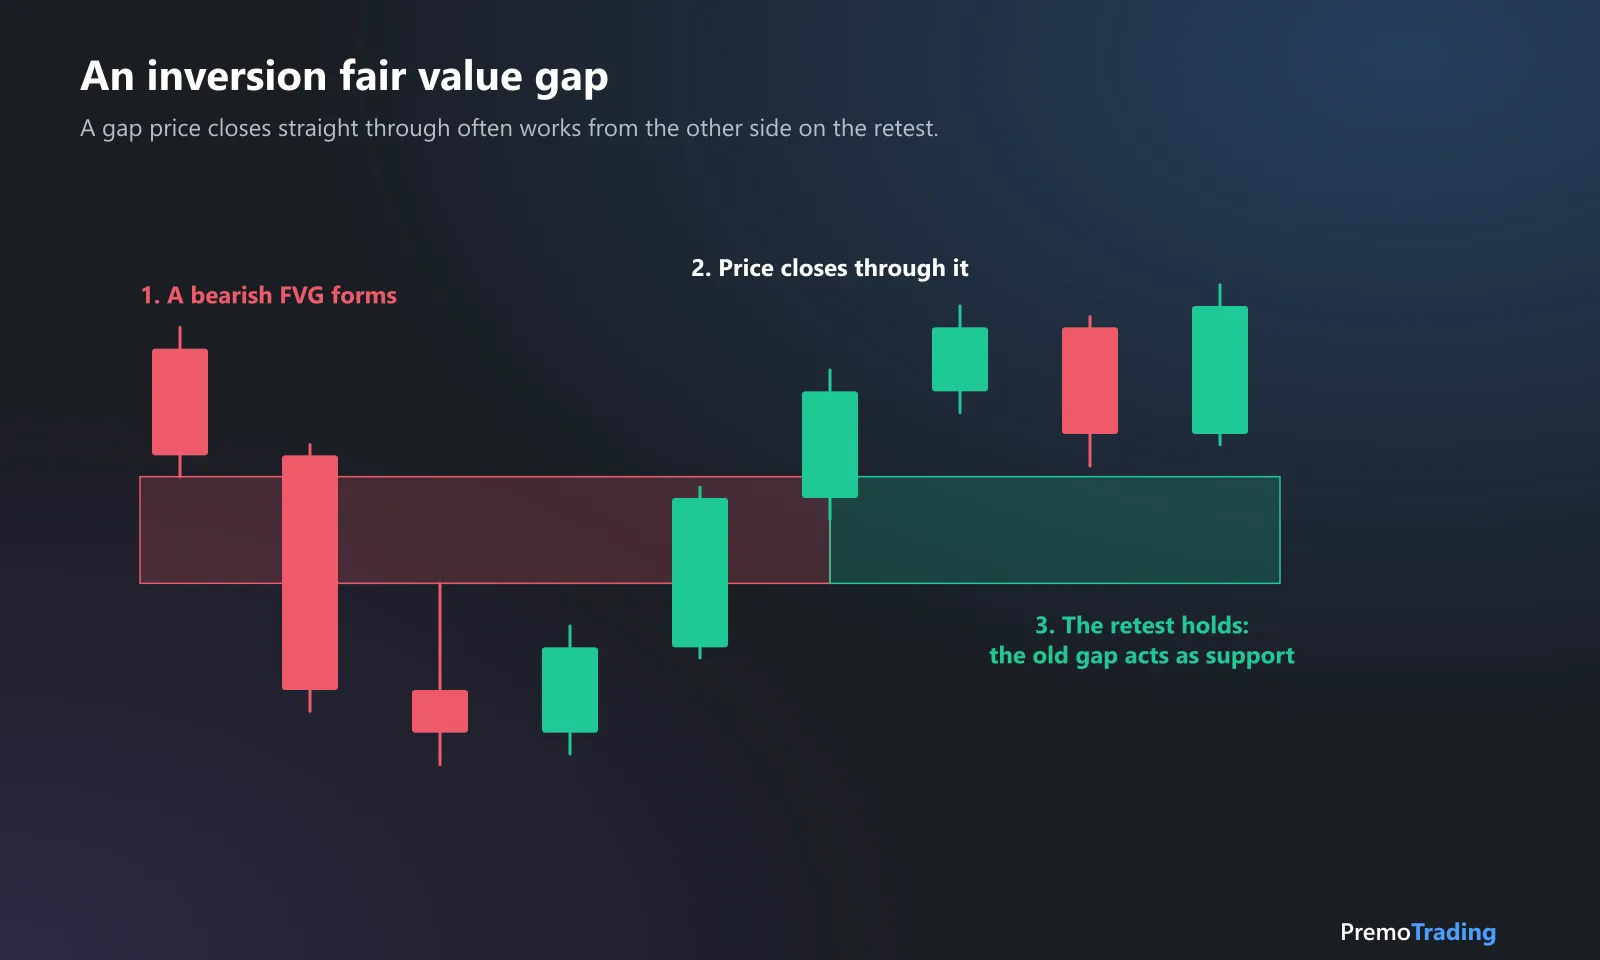
An inversion gap. The sellers who created the bearish gap are now trapped, and the zone they left behind becomes the area buyers defend.
Which fair value gaps matter
Every chart is full of small gaps. Filtering is what turns the pattern into a setup:
- Width. A gap narrower than a small share of price - for example 0.5% on a daily chart, or a few ticks intraday - is noise.
- Age. Gaps lose relevance as more bars print after them. A limit such as 30 bars keeps you focused on recent imbalances.
- Context. The strongest gaps form on the move that broke structure - the impulse that took out a prior high or low. A gap in the middle of a range means little.
- Fill state. An untouched gap is stronger than one already three-quarters filled.
- Direction. Trade bullish gaps in an uptrend or after a bullish change of character, and bearish gaps in a downtrend.
Fair value gaps on different timeframes
| Higher timeframe (daily, 4-hour) | Intraday (5-min, 15-min) | |
|---|---|---|
| What it marks | Large imbalances, multi-day moves | Short-term imbalances inside the session |
| Number of trades | Few | Many |
| Stop size | Wide | Tight |
| Typical use | The area to trade from | The entry inside that area |
A common approach is to combine them: a daily or 4-hour gap marks the area, and a 5-minute gap inside it gives a precise entry with a small stop.
A worked example on MNQ
A 5-minute MNQ chart. After a sell-off, a strong green candle breaks the most recent swing high and leaves a bullish fair value gap behind. Prices are illustrative.
| Level | How it’s set | Price |
|---|---|---|
| Gap bottom | Candle 1’s high | 25,040.25 |
| Gap top | Candle 3’s low | 25,052.75 |
| Entry | Gap midpoint (CE) | 25,046.50 |
| Stop | Below candle 1’s low | 25,035.00 |
| Target | The prior swing high | 25,092.50 |
Risk is 11.5 points ($23 per MNQ contract) and reward is 46 points ($92) - 4:1 reward-to-risk. If price closes a 5-minute bar below the gap bottom before reaching the entry, the gap has failed and the trade is off. For how a 4:1 ratio changes the win rate you need, see our risk-reward ratio guide.
Do fair value gaps always fill?
This is the most searched question about fair value gaps, and the honest answer is no. Some gaps are filled completely, some only to the midpoint, and some - especially in strong trends - are never revisited. Published “fill rates” vary wildly because they depend on the market, the timeframe, how old a gap can be and what counts as a fill.
The useful question isn’t whether gaps fill in general. It’s whether the gaps you trade, with your filters, in your market give you positive expectancy. Record every gap trade, then compare their win rate and expectancy with the rest of your trades after 50 or more. Our guide to expectancy in trading explains how to read the result.
How Premo helps
Premo Trading’s AI Stock Scanner scans your watchlist with strategies written in plain English, so your fair value gap rules - width, age, context and entry - become a repeatable scan that returns entry, stop, target and reasoning for every symbol that qualifies. The Trade Journal then measures how those trades actually perform.
This article is educational and is not investment advice. Trading involves substantial risk of loss.
Frequently asked questions
What is a fair value gap?
A fair value gap is a three-candle pattern where the first and third candles' wicks do not overlap. In a bullish gap, the third candle's low is above the first candle's high; in a bearish gap, the third candle's high is below the first candle's low. The space between them is a price range the market moved through with little two-way trade.
Do fair value gaps always fill?
No. Many gaps are revisited, some only partly, and some never are - especially gaps left by strong trends. How often they fill depends on the market, the timeframe and how you define a fill. The only reliable answer is to measure the gaps you would actually trade.
What is the difference between a fair value gap, an imbalance and a gap?
A classic price gap is a jump between one bar's close and the next bar's open, often overnight. A fair value gap is a three-candle pattern where the wicks of candles 1 and 3 don't overlap, even though the candles themselves are continuous. A volume imbalance, in ICT terms, is a gap between candle bodies while their wicks still overlap.
What is an inversion fair value gap?
An inversion fair value gap (IFVG) is a gap that price closes straight through. A bearish gap that price closes above can then act as support on a retest, and a bullish gap that price closes below can act as resistance. The gap has flipped sides.
What is consequent encroachment?
Consequent encroachment is the 50% level of a fair value gap - the midpoint between its top and bottom. Many traders use it as the entry or as a test: a gap that holds at its midpoint is still respected, while a close through the whole gap means it has failed.
What is the best timeframe for fair value gaps?
Fair value gaps form on every timeframe. Higher-timeframe gaps, such as daily or 4-hour, mark larger imbalances and tend to matter more, while intraday gaps on 5- or 15-minute charts give more trades with smaller stops. Many traders use a higher-timeframe gap as the area and a lower-timeframe one for the entry.