
Call and put options explained, with payoff graphs
Calls and puts explained with simple payoff graphs: the four basic option positions, what each one risks, where it breaks even and how it makes money.
A call option gives its buyer the right to buy something at a set price, the strike, until a set date. A put option gives its buyer the right to sell at the strike. The buyer pays a price for that right, the premium, and the seller collects it. Calls gain value when the price rises and puts gain value when it falls, and you can either buy or sell each one, which gives four basic positions.
Each of those positions has a simple shape when you draw its profit or loss at expiration: a payoff graph. Once you can read the four shapes, you know what every option trade risks, where it breaks even and how it makes money. This guide draws all four, with one example used throughout, then shows why the graph changes before expiration.
Key takeaways
- Calls profit when the price rises; puts profit when it falls. That is from the buyer’s side. The seller takes the opposite side and the opposite view.
- There are four basic positions: buy a call, sell a call, buy a put, sell a put.
- Buyers risk only the premium. Sellers keep the premium if nothing happens, but take on large or unlimited risk.
- Breakeven at expiration is the strike plus the premium for a call, and the strike minus the premium for a put.
- Before expiration, an option is worth more than its payoff graph because of time value, which shrinks every day.
What is an option?
An option is a contract between two sides on an underlying asset: a stock, an ETF, an index or a futures contract. Every option has four terms:
| Term | What it means | In our example |
|---|---|---|
| Underlying | What the option is on | XYZ stock, trading at $100 |
| Strike | The price at which the option can be used | $100 |
| Expiration | The last day the option exists | 45 days from today |
| Premium | What the buyer pays and the seller collects | $4 per share |
US stock and ETF options cover 100 shares, so a quote of $4 means $400 per contract. That multiplier is why every dollar figure below is the price move times 100.
Every option has a buyer (who is “long” the option) and a seller (who is “short” it, also called the writer). The buyer has a right and the seller has an obligation. If the buyer uses the right, called exercising, the seller must deliver.
Calls and puts in one sentence each
- A call is the right to buy at the strike. If XYZ is at $110 at expiration, the right to buy it at $100 is worth $10 a share. If XYZ is at $90, nobody wants to buy at $100, and the call is worth nothing.
- A put is the right to sell at the strike. If XYZ is at $90 at expiration, the right to sell it at $100 is worth $10 a share. If XYZ is at $110, the put is worth nothing.
How much an option is worth at expiration is called its intrinsic value. An option with intrinsic value is in the money; one with none is out of the money; one whose strike is right at the current price is at the money. Our $100 options, with XYZ at $100, are at the money.
The four basic option positions
Each type can be bought or sold, so there are four starting positions. Everything more complex, from covered calls to iron condors, is built from these four.
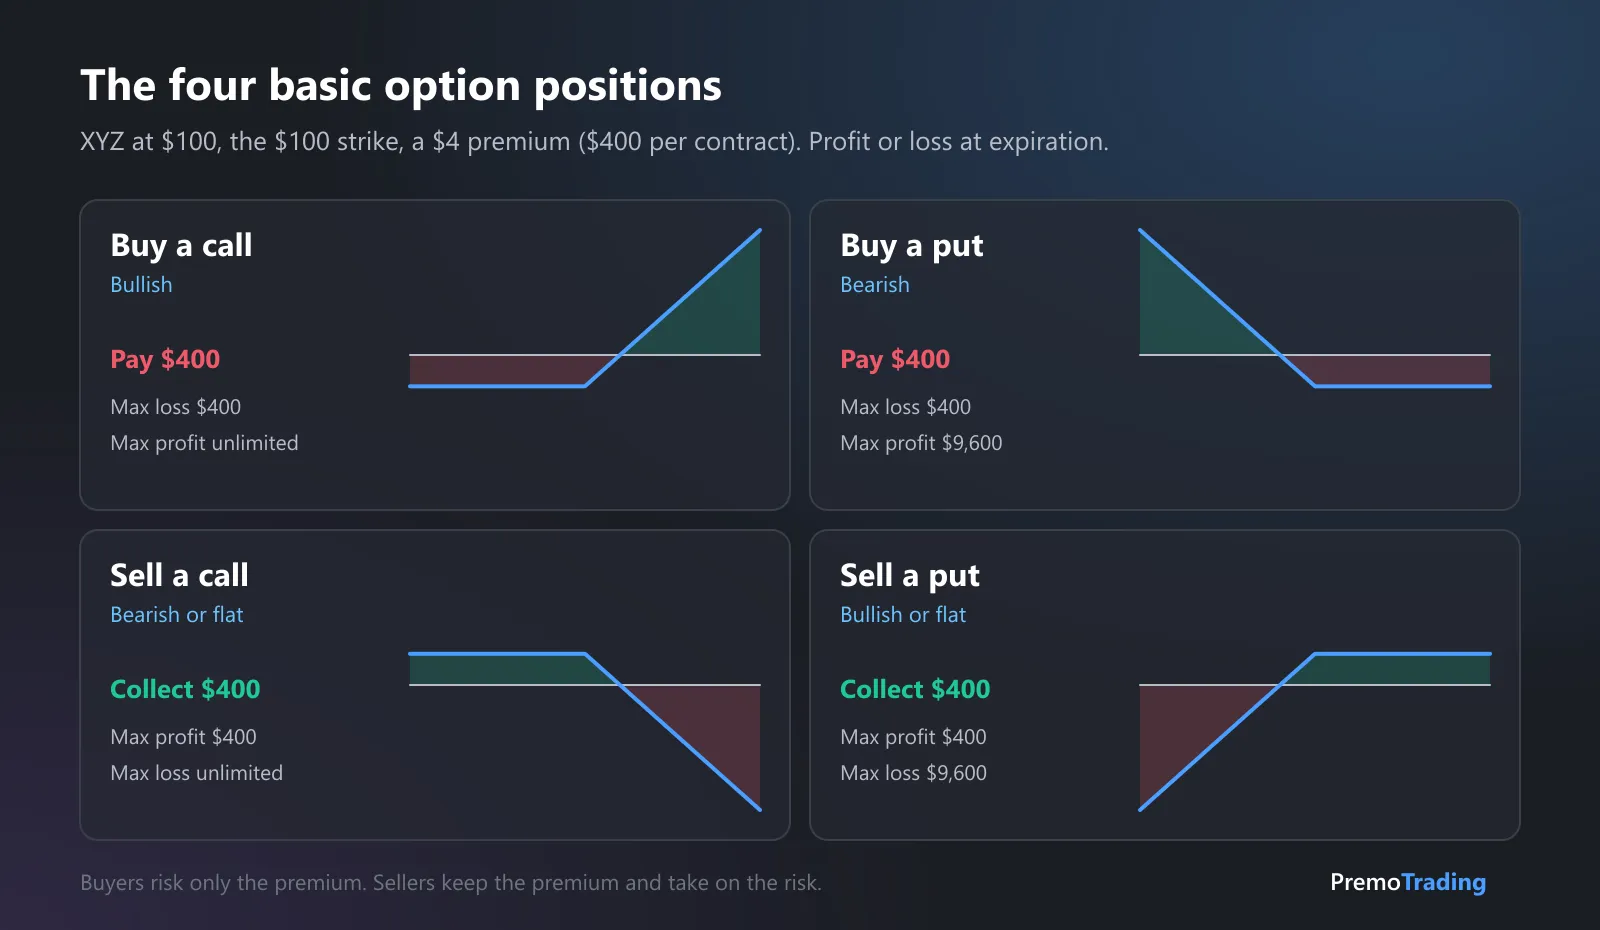
Green is profit and red is loss, at expiration, for one contract. The buyer and the seller of the same option have mirror-image graphs.
| Position | Your view | Cash at the start | Max profit | Max loss | Breakeven |
|---|---|---|---|---|---|
| Buy a call | Up | Pay $400 | Unlimited | $400 | $104 |
| Sell a call | Flat or down | Collect $400 | $400 | Unlimited | $104 |
| Buy a put | Down | Pay $400 | $9,600 | $400 | $96 |
| Sell a put | Flat or up | Collect $400 | $400 | $9,600 | $96 |
How to read a payoff graph
A payoff graph answers one question: if the underlying ends at this price on expiration day, what did I make or lose?
- The horizontal axis is the underlying’s price at expiration.
- The vertical axis is your profit or loss on the position, after the premium.
- The line is the result. Where it is above $0 you make money; below, you lose.
- The kink is always at the strike. That’s where the option starts or stops having intrinsic value.
- The breakeven is where the line crosses $0.
Buying a call: the bullish bet with limited risk
You buy the XYZ $100 call for $4 and pay $400. You are betting XYZ goes up, by more than $4, before the option expires.
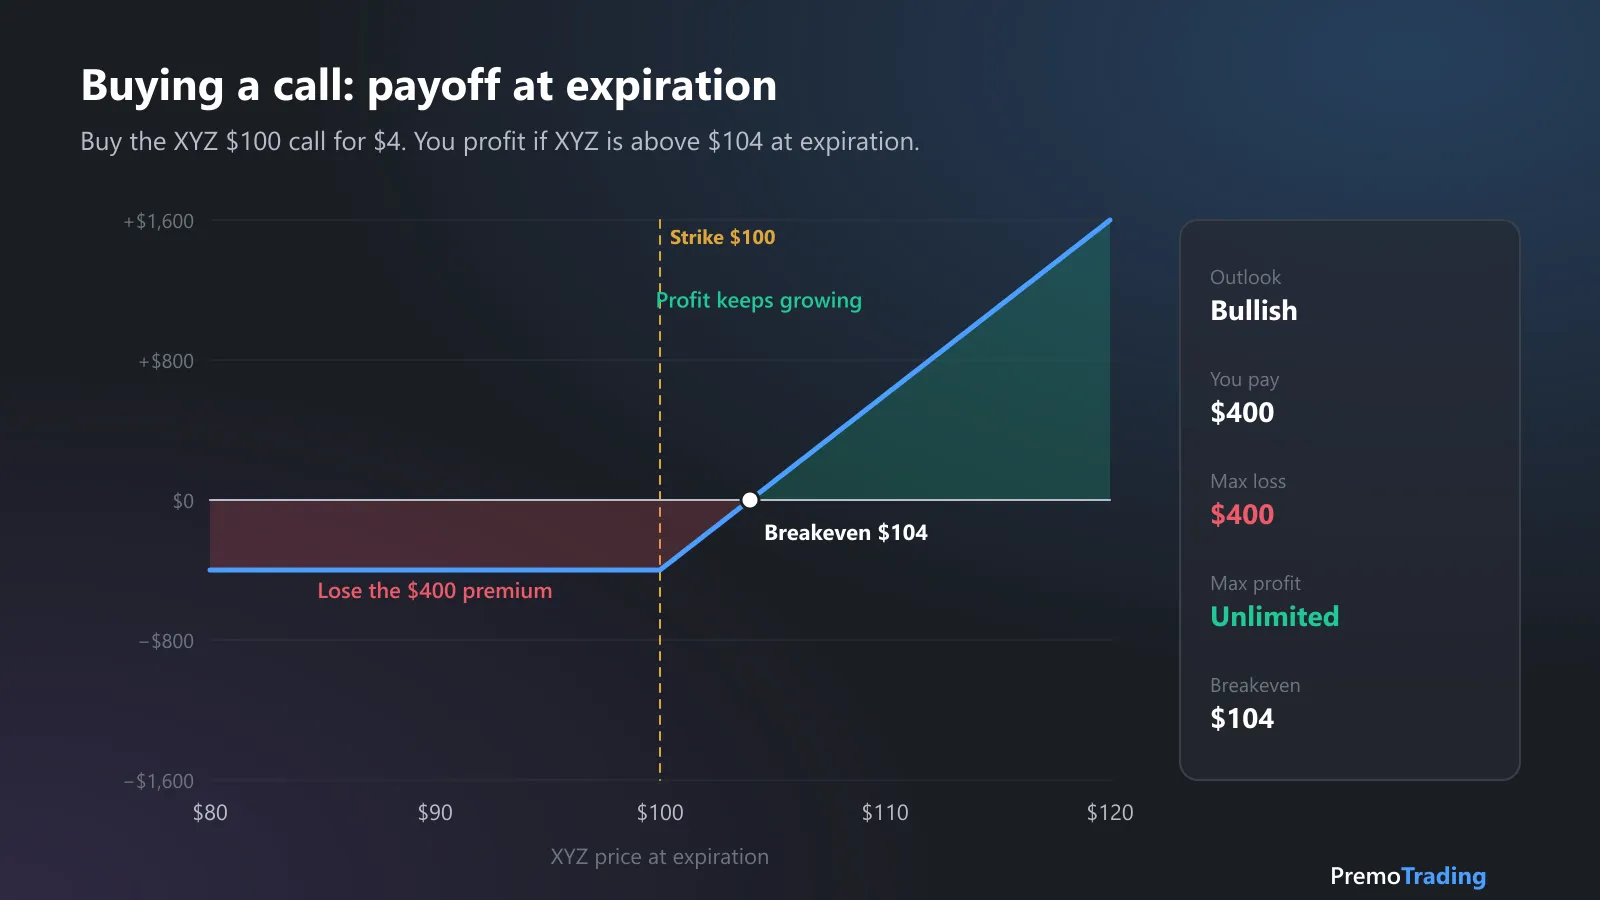
- Below $100: the call expires worthless and you lose the $400 premium. That’s the most you can lose, however far XYZ falls.
- Between $100 and $104: the call has some value but less than you paid. At $102 it’s worth $200, a $200 loss.
- Above $104: you profit. Each $1 higher adds $100. At $110 the call is worth $1,000, a $600 profit, or 150% on the premium.
How you’re profitable: XYZ has to rise past the strike plus the premium. Being right about the direction isn’t enough; the move must be big enough and happen in time.
Selling a call: collecting the premium, with unlimited risk
Someone has to sell the call you just bought. The seller collects the $400 and is betting XYZ stays below $104.
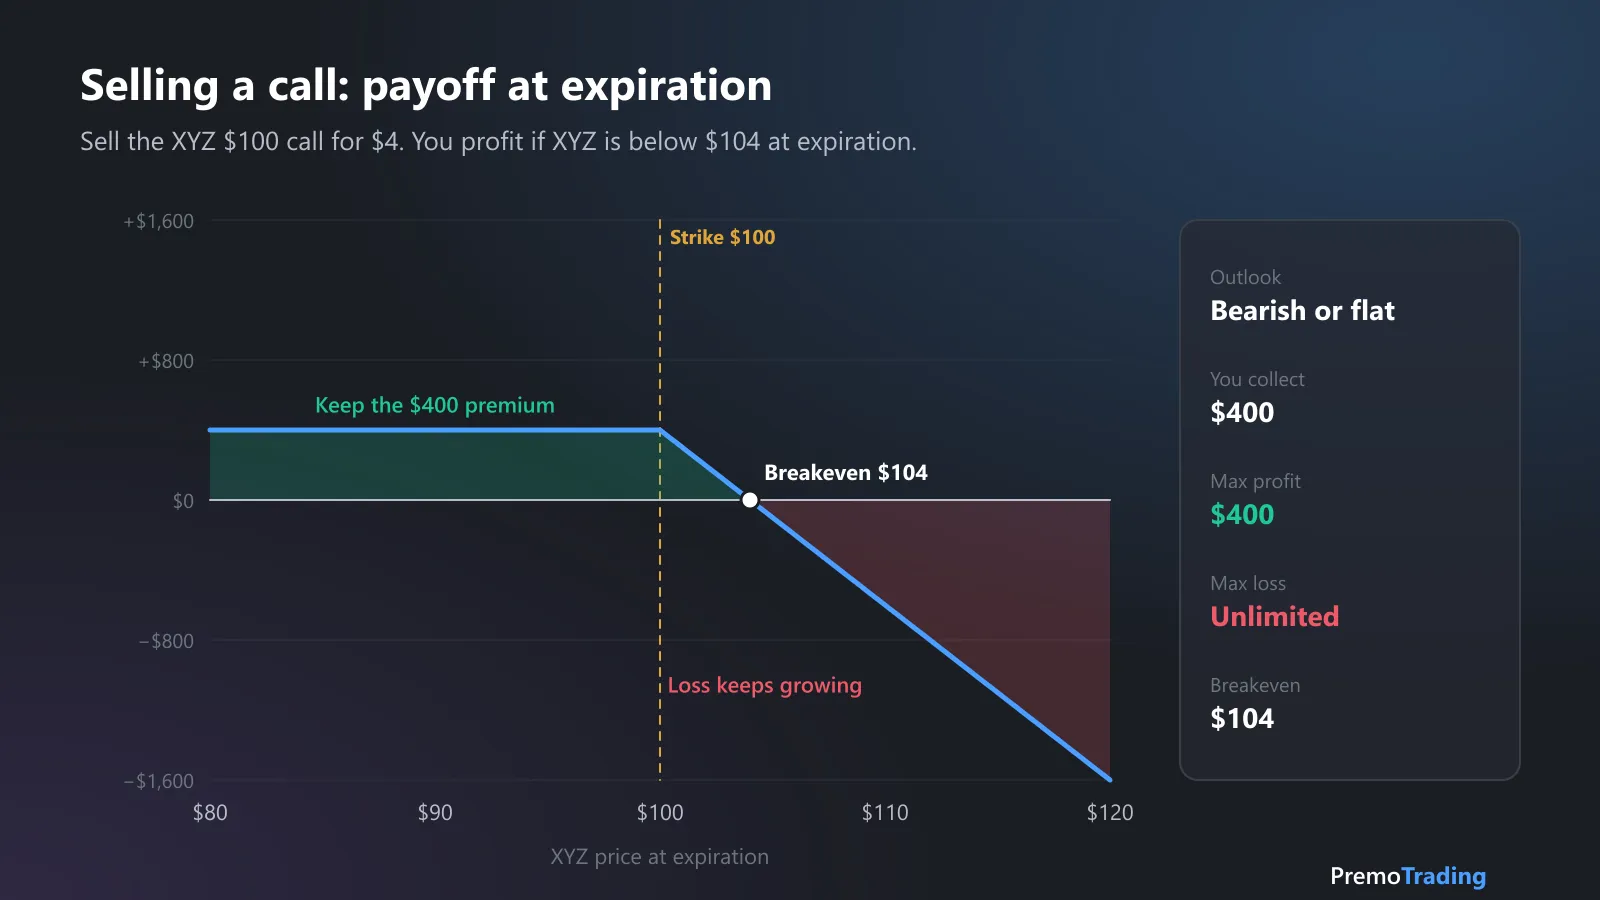
- Below $100: the call expires worthless and the seller keeps the full $400.
- Above $104: the seller loses $100 for every $1 XYZ rises, with no ceiling. A takeover bid that sends XYZ to $150 costs $4,600.
Selling a call without owning the stock is called a naked call, and most brokers only allow it at their highest options approval level. Selling a call against 100 shares you already own is a covered call: the shares cover the obligation, and you give up gains above the strike in exchange for the premium.
Buying a put: the bearish bet, or insurance
You buy the XYZ $100 put for $4. You profit if XYZ falls below $96.
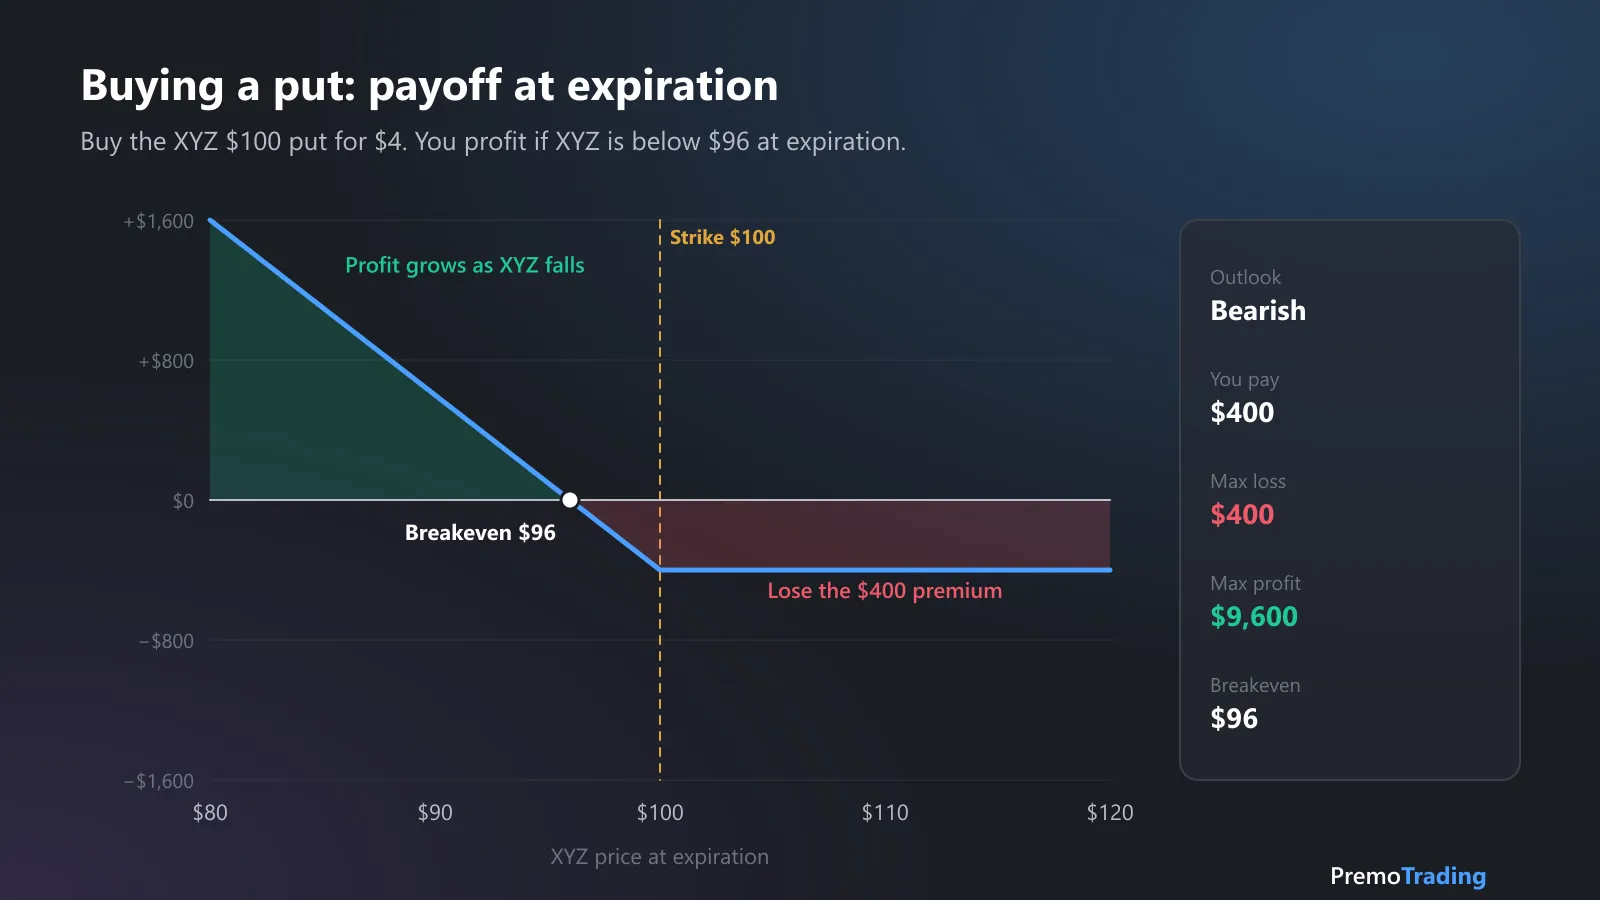
- Above $100: the put expires worthless and you lose the $400.
- Below $96: you profit $100 for every $1 lower. At $90 the put is worth $1,000, a $600 profit.
- The profit has a ceiling. A stock can’t go below zero, so the most the put can make is $96 × 100 = $9,600.
Puts are also how traders insure a position. If you own 100 shares of XYZ, a put caps the loss below the strike, the way a stop loss would, except it can’t be skipped by a gap. Owning the shares and the put together is called a protective put.
Selling a put: getting paid to wait
The put seller collects $400 and is betting XYZ stays above $96. If it doesn’t, they may have to buy 100 shares at $100.
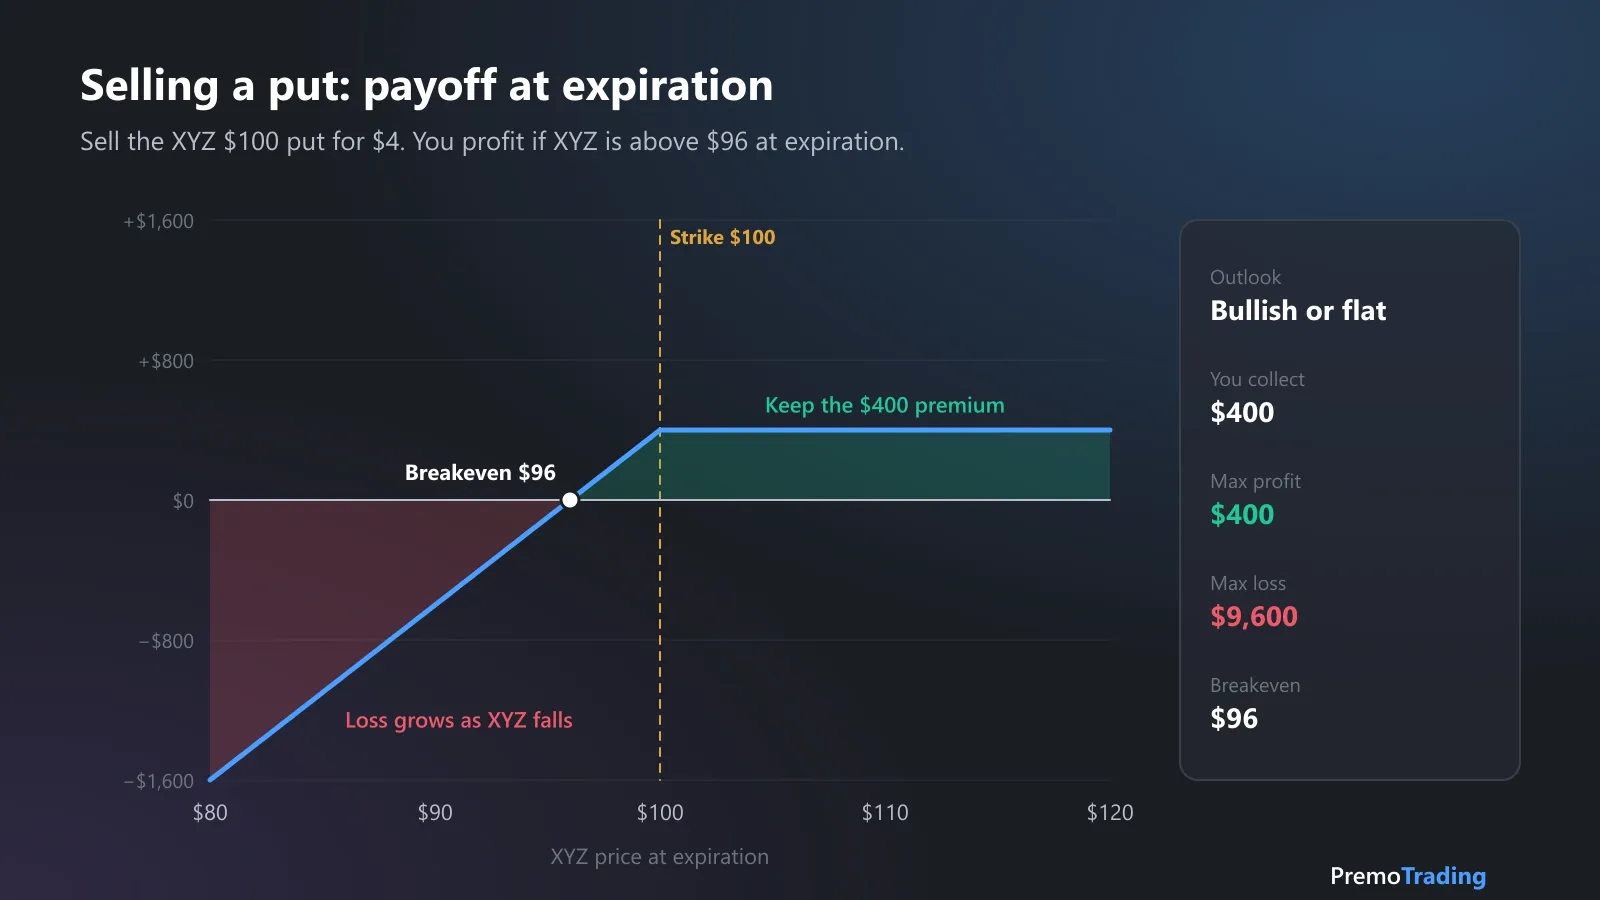
- Above $100: the put expires worthless and the seller keeps $400.
- Below $96: the seller loses $100 for every $1 lower, up to $9,600 if XYZ goes to zero.
Some traders sell puts on stocks they’d be happy to own. If the put is exercised they buy at $100, but the premium makes their real cost $96. That only works if you hold enough cash to buy the shares; a cash-secured put sets that money aside up front.
Why buyers and sellers both trade the same option
Look at the graphs again and a pattern stands out. The buyer has a small, fixed loss and a large possible gain. The seller has a small, fixed gain and a large possible loss. Neither side gets a free lunch; what differs is how often each one wins.
- Buyers win less often but bigger. An out-of-the-money option expires worthless more often than not, so a buyer has many small losses and a few large wins.
- Sellers win more often but smaller. They keep the premium in every case where “nothing happens,” then give back weeks of premium in one bad move.
This is the same trade-off as win rate against risk-reward. A strategy that wins 80% of the time can still lose money if its losses are five times its wins, and a strategy that wins 30% of the time can make money if its wins are big enough. What decides it is expectancy, not the payoff shape alone.
Before expiration: time value
A payoff graph shows the result at expiration. Most options are closed long before that, and until then the option is worth more than its intrinsic value. The extra is time value: what traders will pay for the chance that the price moves further before expiration.
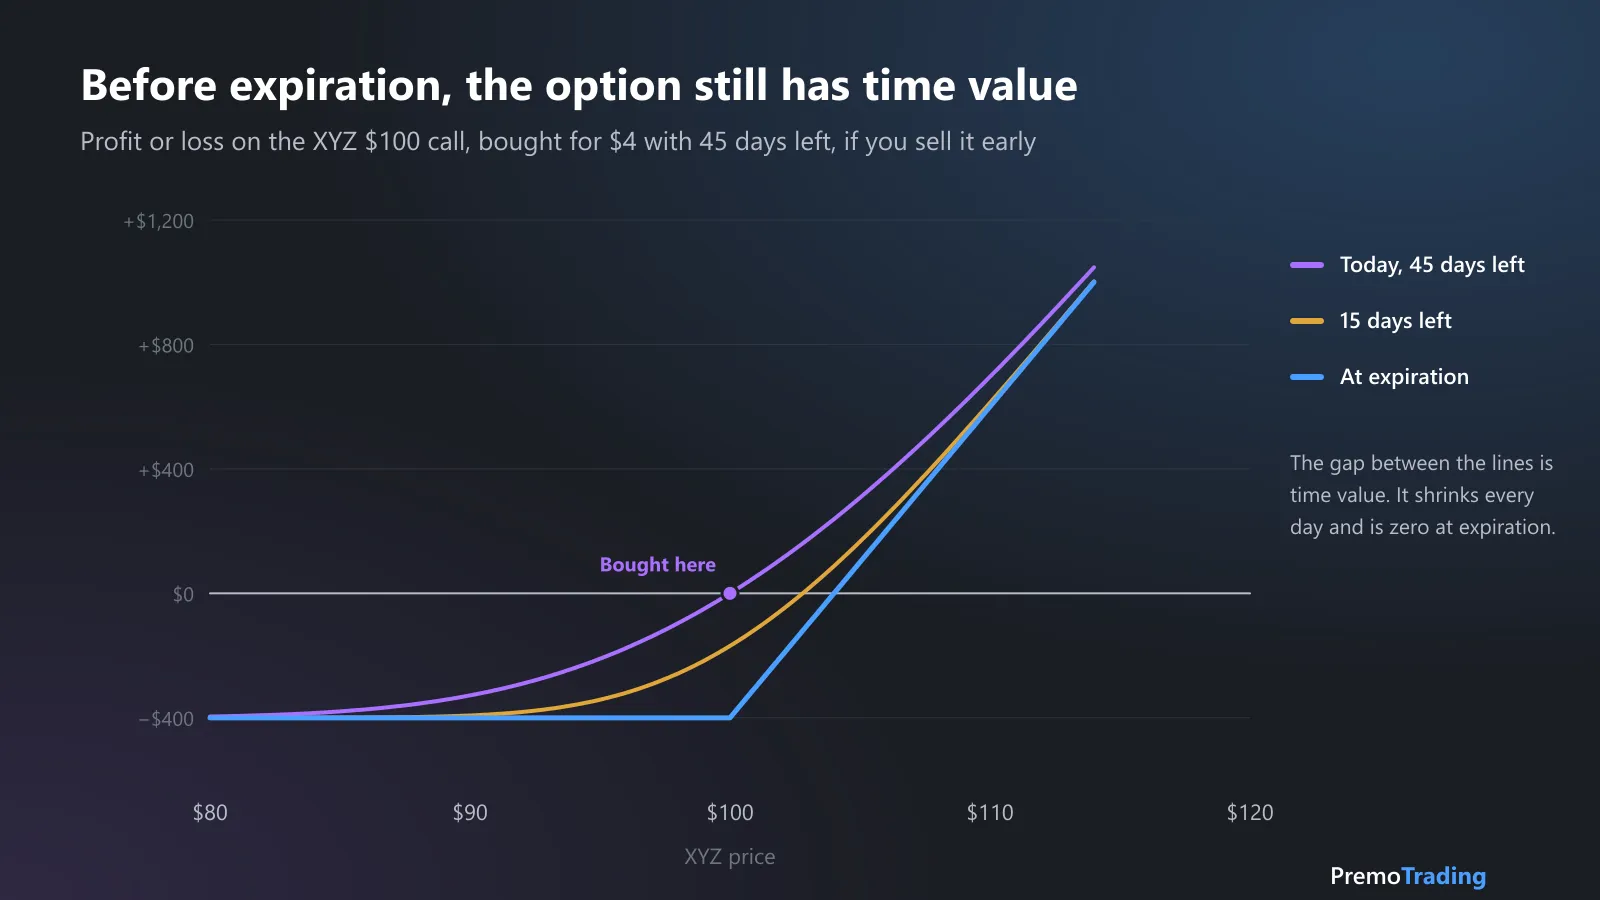
The curves come from the Black-Scholes model at a constant volatility, for illustration. Real prices also move with volatility.
That gap is why buying an option and being right isn’t always enough. Here is the same $4 call in three scenarios:
| What happens | Call price | Profit or loss |
|---|---|---|
| XYZ rises to $105 within 15 days, you sell with 30 days left | about $6.40 | +$240 |
| XYZ is at $105 at expiration | $5.00 | +$100 |
| XYZ is still at $100 with 30 days left | about $3.30 | −$70 |
| XYZ is still at $100 at expiration | $0 | −$400 |
The same $5 move pays $240 if it comes early and $100 if it comes at the end. And if nothing happens, time value drains every day, faster as expiration gets closer. Traders call that decay theta. It is the buyer’s cost and the seller’s income. To watch it happen on an option of your own, the free options profit calculator has a slider for the date and another for volatility.
Options on futures: MNQ, NQ, ES and MES
Options on index futures work the same way, with two differences. The underlying is one futures contract instead of 100 shares, and the multiplier is that contract’s point value. According to CME Group’s contract specifications:
| Option on | Multiplier | $1 point of option premium is worth |
|---|---|---|
| E-mini Nasdaq-100 (NQ) | $20 × index | $20 |
| Micro E-mini Nasdaq-100 (MNQ) | $2 × index | $2 |
| E-mini S&P 500 (ES) | $50 × index | $50 |
| Micro E-mini S&P 500 (MES) | $5 × index | $5 |
So an MNQ call quoted at 120 points costs $240, and every point the option gains or loses moves your P&L by $2, the same as the futures contract. The four payoff shapes are identical; only the dollar scale changes. If you day trade the futures themselves, our MNQ day trading guide covers the contract specs.
Who is on the other side, and why it moves the market
Every option bought is sold by someone, and very often that someone is a dealer, a market maker who quotes prices all day and doesn’t want a directional bet. When a customer buys a put, the dealer who sold it is short a put, which is effectively a long position in the underlying. To stay neutral the dealer hedges by selling futures or stock, and keeps adjusting the hedge as the price moves.
Add that hedging up across every strike and expiration and you get gamma exposure (GEX): an estimate of how much dealers will buy or sell as the market moves. When it’s large, it can hold price in a range or speed up a move. Our guide to gamma exposure explains how it works and why traders of ES, NQ and MNQ watch it, even if they never trade an option.
Before you trade options
- Know which of the four positions you hold. Spreads and strategies are combinations of them; the risk of each piece adds up.
- Know your maximum loss before you enter. For buyers it’s the premium. For sellers, put the worst case on the graph and size for it.
- Mind the clock. A long option needs the move and the time. A short option is paid for time and hurt by sudden moves.
- Check assignment rules. US stock options can be exercised early. If you’re short an option, you can be assigned before expiration, most often just before a dividend or when the option is deep in the money.
- Read the disclosure. US brokers must give you the Options Clearing Corporation’s Characteristics and Risks of Standardized Options before you trade. It’s the official explanation of all of the above.
Sources: the SEC’s Investor.gov definition of options, and the Options Clearing Corporation’s Characteristics and Risks of Standardized Options*, which your broker provides.*
This article is educational and is not investment advice. Options involve substantial risk and are not suitable for all investors. The examples use a hypothetical stock and ignore commissions, fees and taxes.
Frequently asked questions
What is the difference between a call and a put?
A call gives its buyer the right to buy the underlying at the strike price until expiration, so it gains value when the price rises. A put gives its buyer the right to sell at the strike price, so it gains value when the price falls. In both cases the buyer pays a premium and the seller collects it.
How do you make money buying a call?
You profit if the underlying rises above the strike plus the premium you paid by expiration, or if the option rises in price enough to sell it for more than you paid before then. A $100 call bought for $4 breaks even at $104 at expiration. Below the strike, you lose the whole premium.
Is it better to buy or sell options?
Neither is better in general. Buyers risk only the premium and have large or unlimited upside, but they need the move to happen before time value runs out, so they lose more often. Sellers win more often because they keep the premium if nothing happens, but their losses can be many times the premium they collected.
What is the most you can lose on an option?
If you buy a call or a put, the most you can lose is the premium you paid. If you sell a put, the most you can lose is the strike price minus the premium, times the multiplier, if the underlying goes to zero. If you sell a call without owning the underlying, the loss has no limit.
What does breakeven mean for an option?
Breakeven is the price of the underlying at expiration where the position neither makes nor loses money. For a call it is the strike plus the premium; for a put it is the strike minus the premium. It is the same for the buyer and the seller of the same option.
Do you have to hold an option until expiration?
No. Most listed options are closed before expiration by selling the option you bought or buying back the option you sold. Before expiration an option still has time value, so its price differs from the payoff graph at expiration.