
Profit factor in trading: formula, examples and limits
Profit factor in trading explained: the formula, an MNQ example, what a good profit factor is, how fees and sample size change it, and what it hides.
Profit factor is gross profit divided by gross loss: the dollars your winning trades made for every dollar your losing trades lost. Above 1.0, your trades made money, and below 1.0, they lost. A profit factor of 1.5 means $1.50 won for every $1 lost, before you check fees, sample size and outliers.
Profit factor in trading is popular because it fits a whole month on one line. That’s also its weakness. Two traders can share a profit factor of 1.5 and have nothing else in common: one made it over 400 trades, the other over 12 trades and one lucky runner.
This guide covers the formula, a worked example on Micro E-mini Nasdaq-100 futures (MNQ), what counts as good, how profit factor ties to win rate and risk-reward, and the four checks to run before you trust the number: after fees, over enough trades, without the outliers, and by setup.
Key takeaways
- Profit factor = gross profit ÷ gross loss. The only fixed line is 1.0.
- It’s win rate and risk-reward in one number: win rate ÷ loss rate × (average win ÷ average loss).
- Calculate it after fees. In the example below, fees move it from 1.41 to 1.32.
- Small samples lie. Over 30 trades, a true 1.5 can show up as anything from 0.87 to 2.59.
- One total hides the detail. Break it down by setup to see which trades carry the account.
What is profit factor in trading?
Profit factor is the ratio of everything your winners made to everything your losers lost over the same set of trades. It has no units, so it reads the same on one MNQ contract as on ten.
Trading platforms define it the same way. NinjaTrader’s statistics guide gives the formula as gross profit divided by gross loss. MetaTrader 5’s testing report calls it the ratio of gross profit to gross loss, where a value of one means the two are equal. TradingView’s help page says “A value greater than 1.0 indicates a profitable strategy”, and that it counts closed trades only, not open positions.
Two terms to keep straight:
- Gross profit is the sum of all winning trades. It is not your net profit.
- Gross loss is the sum of all losing trades, written as a positive number.
Both totals are zero or more, so a profit factor can’t be negative: the lowest it can be is 0, when no trade won. Breakeven trades add nothing to either total.
How do you calculate profit factor?
The profit factor formula is gross profit ÷ gross loss: divide the total of your winning trades by the total of your losing trades. In steps:
- Pick the trades: one account or one setup, over one period.
- Add up every winning trade. That’s gross profit.
- Add up every losing trade, and drop the minus sign. That’s gross loss.
- Divide gross profit by gross loss.
Here’s an example month: 40 MNQ trades, one contract each. MNQ is worth $2 a point, per CME Group’s contract specs.
| Result | Trades | Average | Total points | Total dollars |
|---|---|---|---|---|
| Winners | 18 | 31 points | 558 | $1,116 |
| Losers | 22 | 18 points | 396 | $792 |
| Net | 40 | +162 | +$324 |
Profit factor = $1,116 ÷ $792 = 1.41. For every dollar the losers cost, the winners brought back $1.41.
The net profit is the gap between the two totals: $324, or $8.10 a trade.
What is a good profit factor?
There is no official threshold. The three platform manuals above draw one line, at 1.0, and none of them says what “good” is. Trading guides quote different cutoffs. They’re rules of thumb, and they don’t agree with each other.
A more useful way to read the number is to ask how much of your gross profit you keep. That share is 1 − (1 ÷ profit factor).
| Profit factor | Gross profit you keep | What it means |
|---|---|---|
| Below 1.0 | None | Losers cost more than winners made |
| 1.0 | 0% | Breakeven before fees, so a loss after them |
| 1.2 | 17% | Profitable, with little room for fees or slippage |
| 1.5 | 33% | A third of what your winners make stays in the account |
| 2.0 | 50% | Half stays. Check the sample size |
| 3.0 and up | 67% or more | Check the sample size and the outliers first |
A thin margin isn’t wrong in itself, and the right number depends on how often you trade. At the example’s $792 of gross loss per 40 trades, a profit factor of 1.2 keeps $158. A scalper who takes 400 such trades a month keeps ten times that, so a thin ratio can still pay, as long as it’s measured after costs. A swing trader with 10 trades a month needs a higher ratio to make the same money, and far longer to prove it.
The lower the number, the less a bad month or a wider spread has to take before it reaches 1.0.
How does profit factor relate to win rate and risk-reward?
Profit factor vs win rate is not a choice between two numbers, because one contains the other. Profit factor is your win-to-loss ratio multiplied by your risk-reward:
Profit factor = (win rate ÷ loss rate) × (average win ÷ average loss)
In the example, the win rate is 45% and the average win is 31 points against an average loss of 18, a realized risk-reward ratio of 1.72. So (0.45 ÷ 0.55) × 1.72 = 1.41, the same answer as before.
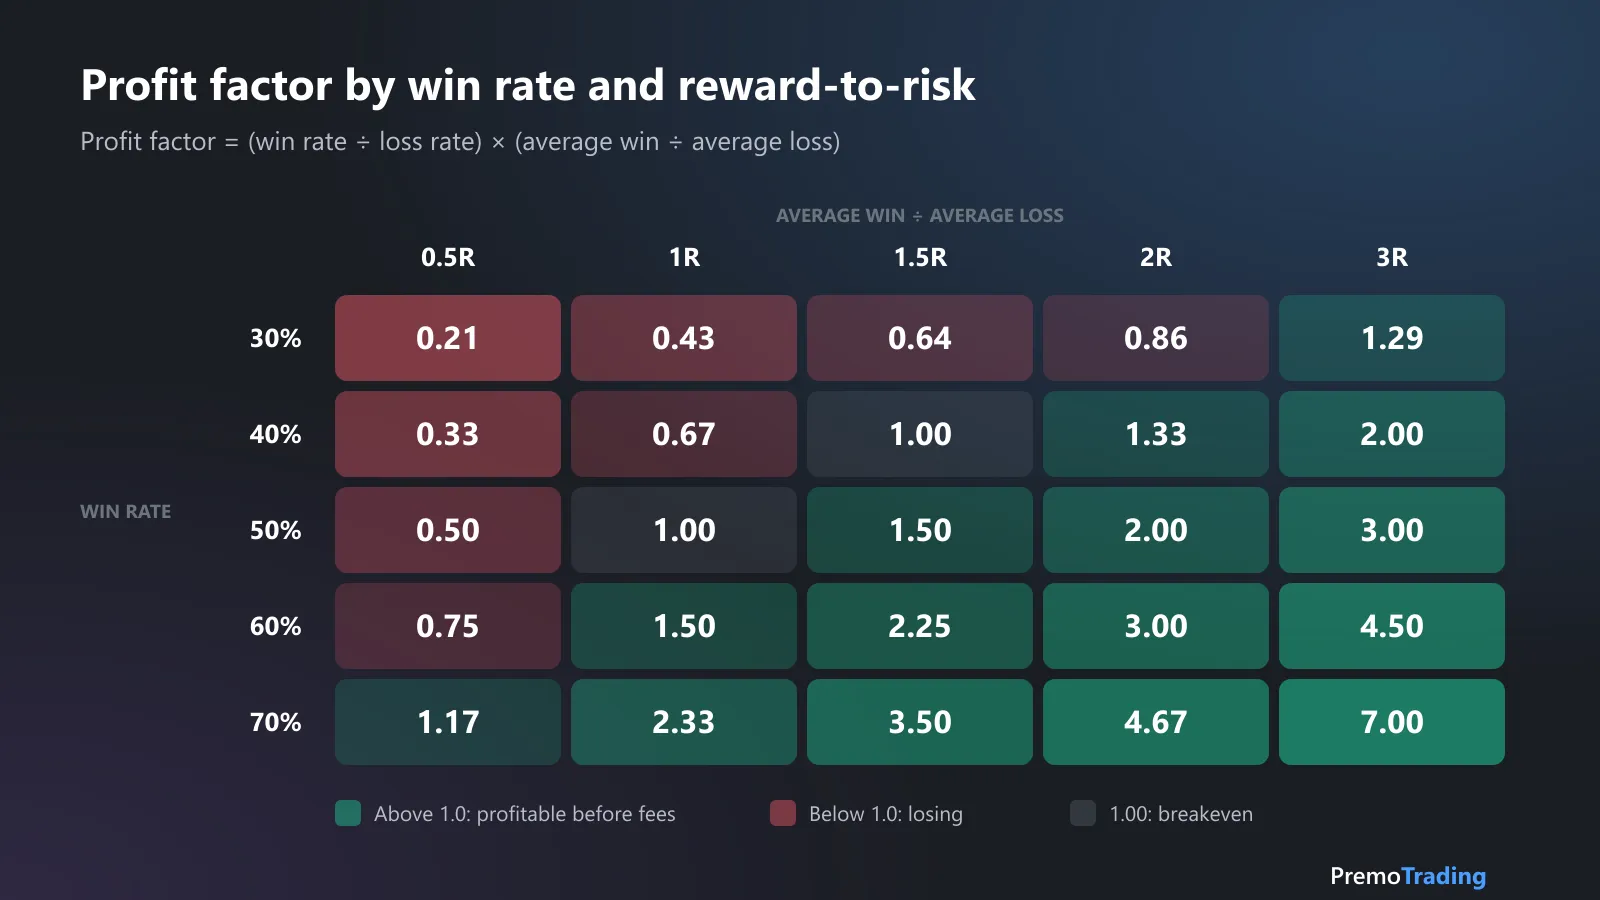
Every cell is (win rate ÷ loss rate) × reward-to-risk. Cells above 1.0 are profitable before fees.
| Win rate | 0.5R | 1R | 1.5R | 2R | 3R |
|---|---|---|---|---|---|
| 30% | 0.21 | 0.43 | 0.64 | 0.86 | 1.29 |
| 40% | 0.33 | 0.67 | 1.00 | 1.33 | 2.00 |
| 50% | 0.50 | 1.00 | 1.50 | 2.00 | 3.00 |
| 60% | 0.75 | 1.50 | 2.25 | 3.00 | 4.50 |
| 70% | 1.17 | 2.33 | 3.50 | 4.67 | 7.00 |
The table shows why win rate alone says little. A 70% win rate with winners half the size of losers has a profit factor of 1.17. A 40% win rate with winners twice the size of losers reaches 1.33. To try your own numbers, use the win rate vs risk-reward calculator.
Profit factor vs expectancy: what’s the difference?
Profit factor is a ratio, and expectancy is an amount. Expectancy is what you make or lose on the average trade. Both come from the same trades, and they always agree on the sign:
Expectancy = (profit factor − 1) × gross loss ÷ number of trades
In the example: (1,116 ÷ 792 − 1) × $792 ÷ 40 = $8.10 a trade.
| Question | Profit factor | Expectancy |
|---|---|---|
| Answers | How many dollars won per dollar lost? | What is one trade worth? |
| Unit | None | Dollars or R |
| Good for | Comparing setups, accounts and periods | Sizing, and projecting a month |
| Changes with position size | No | Yes |
A profit factor of 2.0 can still be a $1 expectancy if the trades are tiny. Read the two together. Our guide to expectancy covers the second number.
Does profit factor include commissions and fees?
It depends on which P&L you feed it, so calculate it on net results. The three platform manuals define gross profit and gross loss as sums of winning and losing trades, and don’t say whether commissions are taken out first.
Fees hit both sides of the ratio. They make every winner smaller and every loser bigger. Take the example month and assume $1.50 per contract, round turn, in commissions and exchange fees. That’s an illustration, so check your broker’s schedule.
| Result | Before fees | After fees |
|---|---|---|
| Gross profit | $1,116 | $1,089 |
| Gross loss | $792 | $825 |
| Net profit | $324 | $264 |
| Profit factor | 1.41 | 1.32 |
$60 in fees took 19% of the month’s profit. The thinner the margin and the more often you trade, the more this matters: a 1.10 before fees can fall to about 1.0 after them.
How many trades do you need before profit factor means anything?
At least 100, and more is better. Below that, luck moves the number more than skill does.
Take a strategy with a true profit factor of exactly 1.5: it wins half the time, every winner is 1.5R and every loser is 1R. We calculated, from the binomial distribution, the range its measured profit factor falls in about 90% of the time.
| Trades | Low end | High end | Chance it shows below 1.0 |
|---|---|---|---|
| 30 | 0.87 | 2.59 | 10.0% |
| 50 | 0.92 | 2.45 | 5.9% |
| 100 | 1.09 | 2.07 | 1.8% |
| 300 | 1.24 | 1.81 | Under 0.1% |
| 1,000 | 1.35 | 1.66 | Under 0.1% |
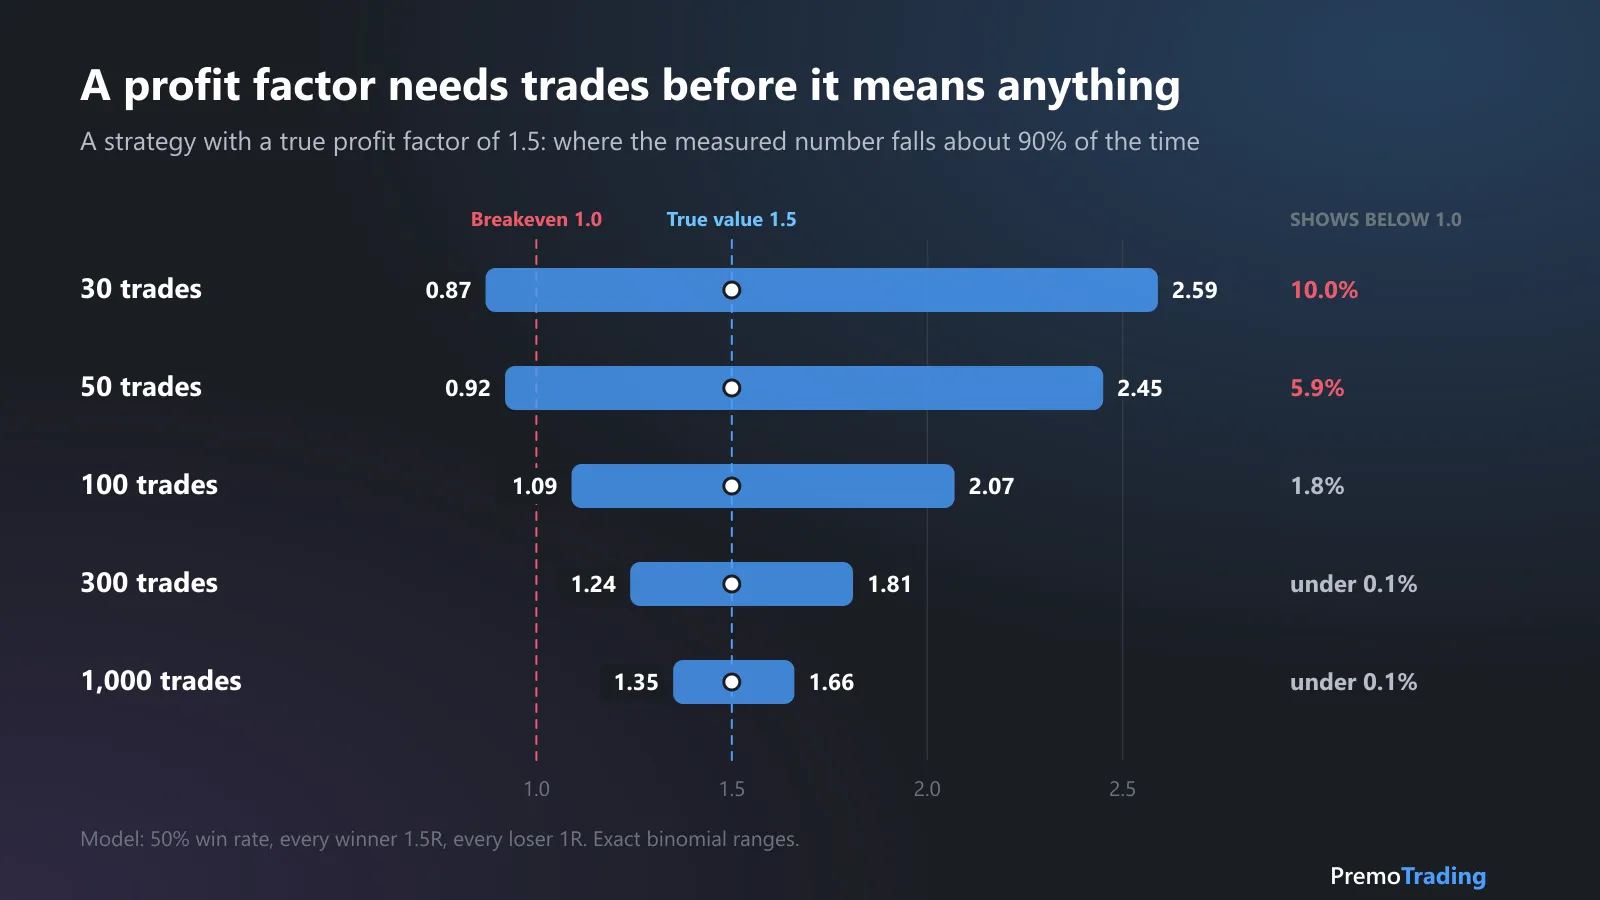
The same strategy, measured over more and more trades. The range narrows toward 1.5.
After 30 trades, the same winning strategy can look like a losing one (0.87) or an exceptional one (2.59). One time in ten, it shows a profit factor below 1.0. Real trades vary more than this model, because winners and losers aren’t all one size, so real ranges are wider.
Can a profit factor be too high?
Yes. A very high profit factor usually says more about the sample than about the trader. There are three common causes:
- Too few trades. See the table above.
- One outsized winner. Suppose the best trade in the example month was +120 points, or $240. Without it, gross profit is $876 and the profit factor is 876 ÷ 792 = 1.11. One trade out of 40 was the difference between 1.41 and 1.11.
- A tuned backtest. Rules fitted to past data can produce numbers that live trading doesn’t repeat.
With no losing trades at all, gross loss is zero and profit factor can’t be calculated. That isn’t a perfect score. It’s a sample that hasn’t met a loss yet.
The check takes a minute: remove your biggest winner and your biggest loser, then recalculate. Our guide to trading without P&L outliers explains how to read what’s left.
What does profit factor not tell you?
It doesn’t tell you the order of the trades, the size of the profit, or how deep the drawdown was.
- Drawdown. Profit factor is the same whatever order the trades came in. If the example’s 22 losers arrived in a row, the account would be down $792 before the first winner, with the same 1.41 at the end of the month. On a prop firm account with a trailing drawdown, the order can end the account. Risk of ruin puts a probability on that.
- Dollars. A ratio has no size. 1.41 on 40 trades made $324 here. The same 1.41 on 400 trades of the same size would make ten times that.
- Risk taken. It doesn’t know your stop or your account size.
Read it next to net P&L, expectancy and max drawdown, never alone.
Should you track profit factor overall or by setup?
Both, and the breakdown is where the decisions are. Here is the same example month, split by setup:
| Setup | Trades | Gross profit | Gross loss | Profit factor |
|---|---|---|---|---|
| Opening range breakout | 16 | $700 | $300 | 2.33 |
| Fair value gap entry | 14 | $336 | $252 | 1.33 |
| No setup (unplanned) | 10 | $80 | $240 | 0.33 |
| All trades | 40 | $1,116 | $792 | 1.41 |
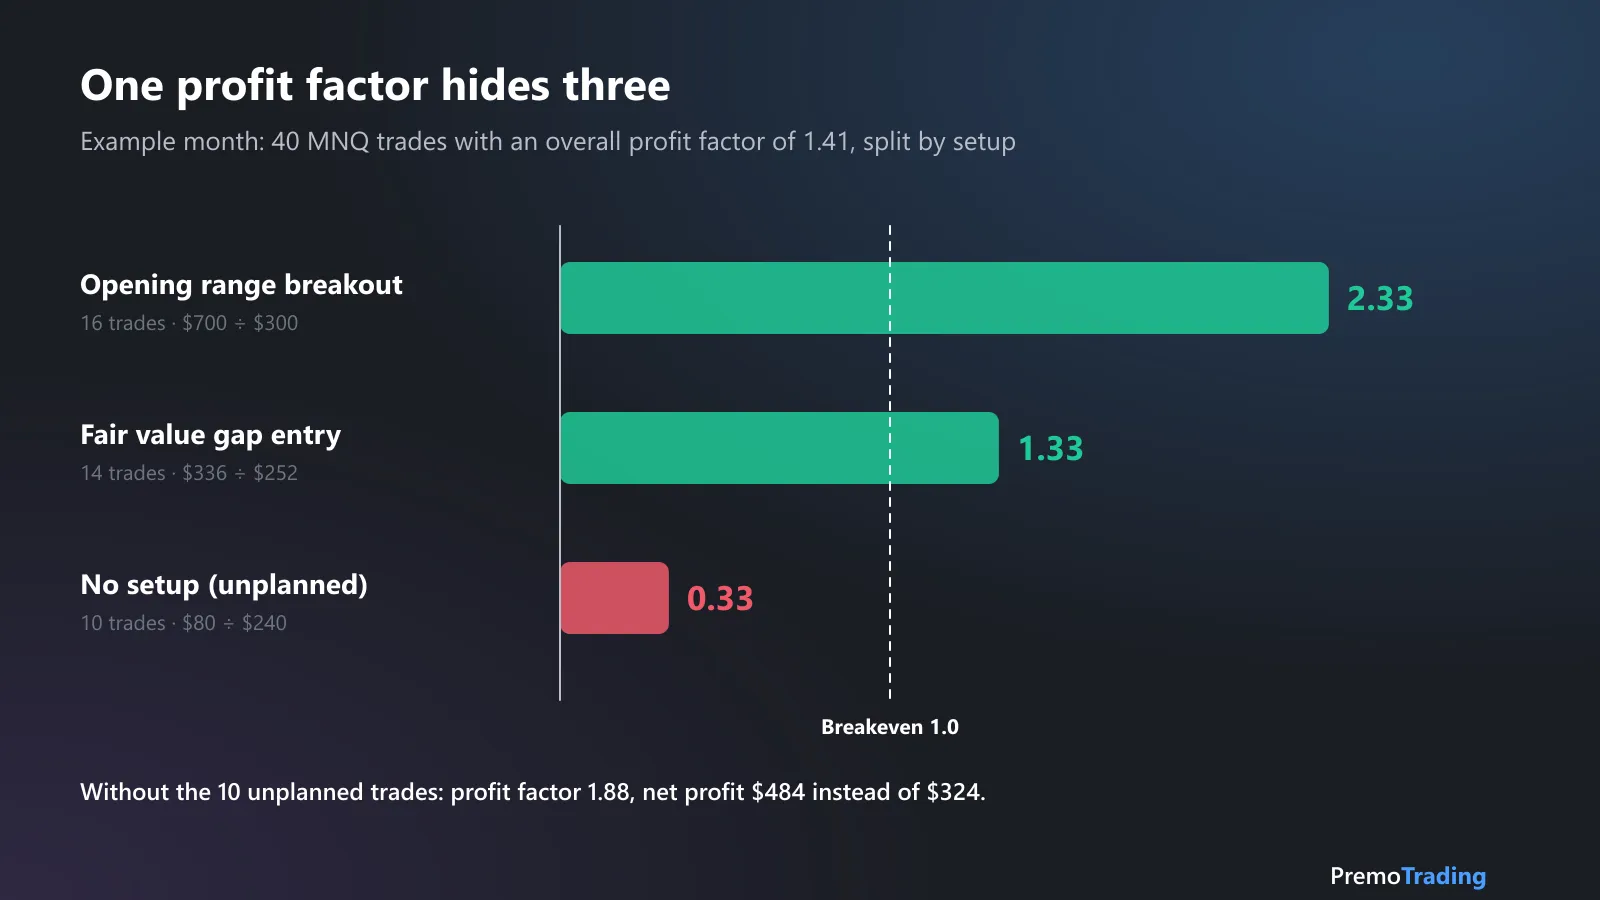
Example. The overall 1.41 blends a strong setup, a modest one and a group of trades that lose.
The 10 unplanned trades lost $160 between them. Without them, the month is 26 trades with a profit factor of 1.88 and a net profit of $484 instead of $324.
Keep the sample-size rule in mind here too. Sixteen trades is far too few to trust a 2.33, so treat a breakdown as a place to look, and wait for more trades before you change size.
How do you improve profit factor?
The ratio only moves when gross profit rises or gross loss falls. That leaves four levers, and the example month shows the size of each:
| Lever | In the example | Profit factor |
|---|---|---|
| Starting point | 40 trades, before fees | 1.41 |
| Drop a losing group of trades | Without the 10 unplanned trades | 1.88 |
| Smaller average loss | 16 points instead of 18 | 1.59 |
| Larger average win | 34 points instead of 31 | 1.55 |
| Lower costs | $1.00 a round turn instead of $1.50, after fees | 1.35 instead of 1.32 |
These are arithmetic on one example, not a forecast: a tighter stop also turns some winners into losers, so the levers aren’t independent. What the table does show is where to look first. Removing trades that have no setup changed the ratio more than any change to stops or targets.
How Premo helps
Premo Trading works out the inputs from your imported trades, so there’s nothing to add up by hand:
- Win rate, average win, average loss and Risk:Reward sit together in Performance Analytics. Profit factor is one line from there: win rate ÷ loss rate × Risk:Reward.
- Gross or net. Switch the statistics between results before and after commissions and fees.
- Without the outliers. Leave out your biggest winners and losers, and every statistic recalculates next to the full set.
- By setup. The Playbook shows win rate and expectancy for each setup you’ve written down.
Sources
- TradingView: Profit factor: definition, the 1.0 line, and closed trades only. Read November 12, 2026.
- NinjaTrader 8 help guide: Statistics definitions: profit factor as gross profit divided by gross loss. Read November 12, 2026.
- MetaTrader 5 help: Testing report: profit factor, gross profit and gross loss. Read November 12, 2026.
- CME Group: Micro E-mini Nasdaq-100 contract specs: MNQ is $2 per index point. Read November 12, 2026.
This article is educational and is not investment advice. The trades, statistics and results shown are examples, not recommendations or actual results. Trading futures involves substantial risk of loss.
Frequently asked questions
What is profit factor in trading?
Profit factor is gross profit divided by gross loss: the total made on winning trades divided by the total lost on losing trades over the same period. A profit factor of 1.5 means the winners made $1.50 for every $1 the losers lost. Above 1.0 the trades made money overall, and below 1.0 they lost.
What is a good profit factor?
There is no official cutoff. Above 1.0 is profitable, and the further above 1.0, the more room you have for fees, slippage and a bad month. At 1.2 you keep about 17% of your gross profit, at 1.5 a third and at 2.0 half. Judge it after fees and over at least 100 trades.
How do you calculate profit factor?
Add up the profit on every winning trade to get gross profit. Add up the loss on every losing trade to get gross loss. Divide the first by the second. For example, $1,116 of winning trades and $792 of losing trades give 1,116 ÷ 792 = 1.41. Use results after commissions and fees.
Is profit factor better than win rate?
It tells you more. Win rate counts how often you win, and ignores how much. Profit factor combines both: it equals win rate divided by loss rate, multiplied by your average win divided by your average loss. A 40% win rate with winners twice the size of losers has a profit factor of 1.33.
What is the difference between profit factor and expectancy?
Profit factor is a ratio: dollars won per dollar lost. Expectancy is an amount: the average profit or loss per trade. They always agree on the sign, so a profit factor above 1.0 means positive expectancy. Use profit factor to compare setups, and expectancy to see what each trade is worth in dollars.
Can a profit factor be too high?
Yes. Treat a profit factor above 3 as a number to check, not to celebrate. The usual causes are very few trades, one or two outsized winners, or a backtest tuned to past data. Remove your biggest winner and calculate it again. If the number drops toward 1.0, the result depends on one trade.