
Risk of ruin in trading: formula, tables and prop odds
Risk of ruin in trading explained: the formula, tables by win rate and risk per trade, losing streak odds, and the math on a prop firm drawdown.
Risk of ruin is the probability that a run of losses takes your account down to a level where you have to stop trading, before your edge has time to work. It depends on your win rate, the size of your winners against your losers, and how much you risk per trade. Size is the part you control.
Risk of ruin in trading answers a question that expectancy can’t. Expectancy says what the average trade is worth. It doesn’t say whether you’ll still have an account after the bad stretch that every strategy has sooner or later.
This guide covers the formula and where it comes from, tables for five example strategies, the odds of a losing streak, and the version that matters to most futures traders now: the chance of hitting a prop firm drawdown before the profit target. We calculated every table here, and the method is given under each one.
Key takeaways
- Ruin is a level you choose, not zero. On a prop account it’s the drawdown limit.
- Count in losses, not dollars. Room to the floor ÷ risk per trade = the number of losses you can take.
- Same expectancy, different risk. Three strategies that each make 0.2R a trade have a risk of ruin of 1.7%, 14.2% and 27.7% at the same size.
- A trailing drawdown makes it worse. In our example evaluation, a 13.6% chance of failing becomes 30.9%.
- No size saves a strategy without an edge. At zero or negative expectancy, ruin is certain if you keep trading.
What is risk of ruin in trading?
Risk of ruin is the chance that your losses reach a set limit before your profits carry you away from it. The idea is much older than trading. It comes from the gambler’s ruin problem, which Pascal, Fermat and Huygens worked on in the 1650s, according to Wikipedia’s history of the problem.
“Ruin” needs a definition before it has a probability. It can mean:
- The whole account, which is rare in practice. Most traders stop, or are stopped, well before zero.
- A drawdown you won’t trade through, such as 30% of the account.
- A prop firm’s maximum drawdown. On a $50,000 account with a $2,000 drawdown, ruin is $2,000 away, not $50,000.
Call the amount you can lose your loss budget. The rest of this guide measures size against it.
How do you calculate risk of ruin?
Divide your loss budget by your risk per trade to get the number of losses you can take, then use the formula below if winners and losers are the same size, or the tables if they aren’t.
Losses you can take (N) = loss budget ÷ risk per trade
With a $2,000 budget and $200 at risk per trade, N is 10.
The classic formula: winners and losers the same size
When every winner makes 1R and every loser costs 1R:
Risk of ruin = (loss rate ÷ win rate)^N
This is the gambler’s ruin result. In his Columbia University lecture notes, Karl Sigman derives the probability of ruin as (q ÷ p)^i for a gambler who starts with i units and wins each bet with probability p, where q = 1 − p. It applies only when p is above 0.5. Otherwise, in his words, “ruin is certain.”
Example: a 55% win rate and room for 10 losses gives (0.45 ÷ 0.55)^10 = 13.4%. With room for 20 losses, it’s 1.8%.
Many trading sites print the same formula as ((1 − A) ÷ (1 + A))^N, where A is the win rate minus the loss rate. It’s identical: with a 55% win rate, A is 0.10, and 0.90 ÷ 1.10 equals 0.45 ÷ 0.55.
When winners are bigger than losers
Most day traders don’t win and lose the same amount, and the classic formula has no place for that. If every loser costs 1R and every winner makes R times as much, the risk of ruin is x^N, where x is the number between 0 and 1 that solves:
win rate × x^(R+1) − x + loss rate = 0
There’s no tidy answer for x, so it’s solved numerically. For a 40% win rate and 2R winners, x is 0.823, and the risk of ruin with room for 10 losses is 0.823^10 = 14.2%.
A common shortcut puts expectancy in R into the classic formula as A. For this strategy, expectancy is +0.2R, and the shortcut gives (0.8 ÷ 1.2)^10 = 1.7%. The exact figure is 14.2%, eight times higher. The shortcut treats a 40% win rate with 2R winners as if it were a 60% win rate with 1R winners. Both make 0.2R a trade, but the first has longer losing streaks.
Risk of ruin by win rate and risk per trade
The fewer losses you have room for, the higher the risk of ruin, and for the same expectancy it’s higher for strategies with a low win rate. The table shows five example strategies, each risking the same dollar amount on every trade.
| Losses you can take | Share of budget per trade | 55% win, 1R | 60% win, 1R | 40% win, 2R | 30% win, 3R | 50% win, 2R |
|---|---|---|---|---|---|---|
| 4 | 25% | 44.8% | 19.8% | 45.8% | 59.8% | 14.6% |
| 5 | 20% | 36.7% | 13.2% | 37.7% | 52.6% | 9.0% |
| 8 | 12.5% | 20.1% | 3.9% | 21.0% | 35.8% | 2.1% |
| 10 | 10% | 13.4% | 1.7% | 14.2% | 27.7% | 0.8% |
| 20 | 5% | 1.8% | 0.03% | 2.0% | 7.7% | Under 0.01% |
| 40 | 2.5% | 0.03% | Under 0.01% | 0.04% | 0.6% | Under 0.01% |
| Expectancy | +0.10R | +0.20R | +0.20R | +0.20R | +0.50R |
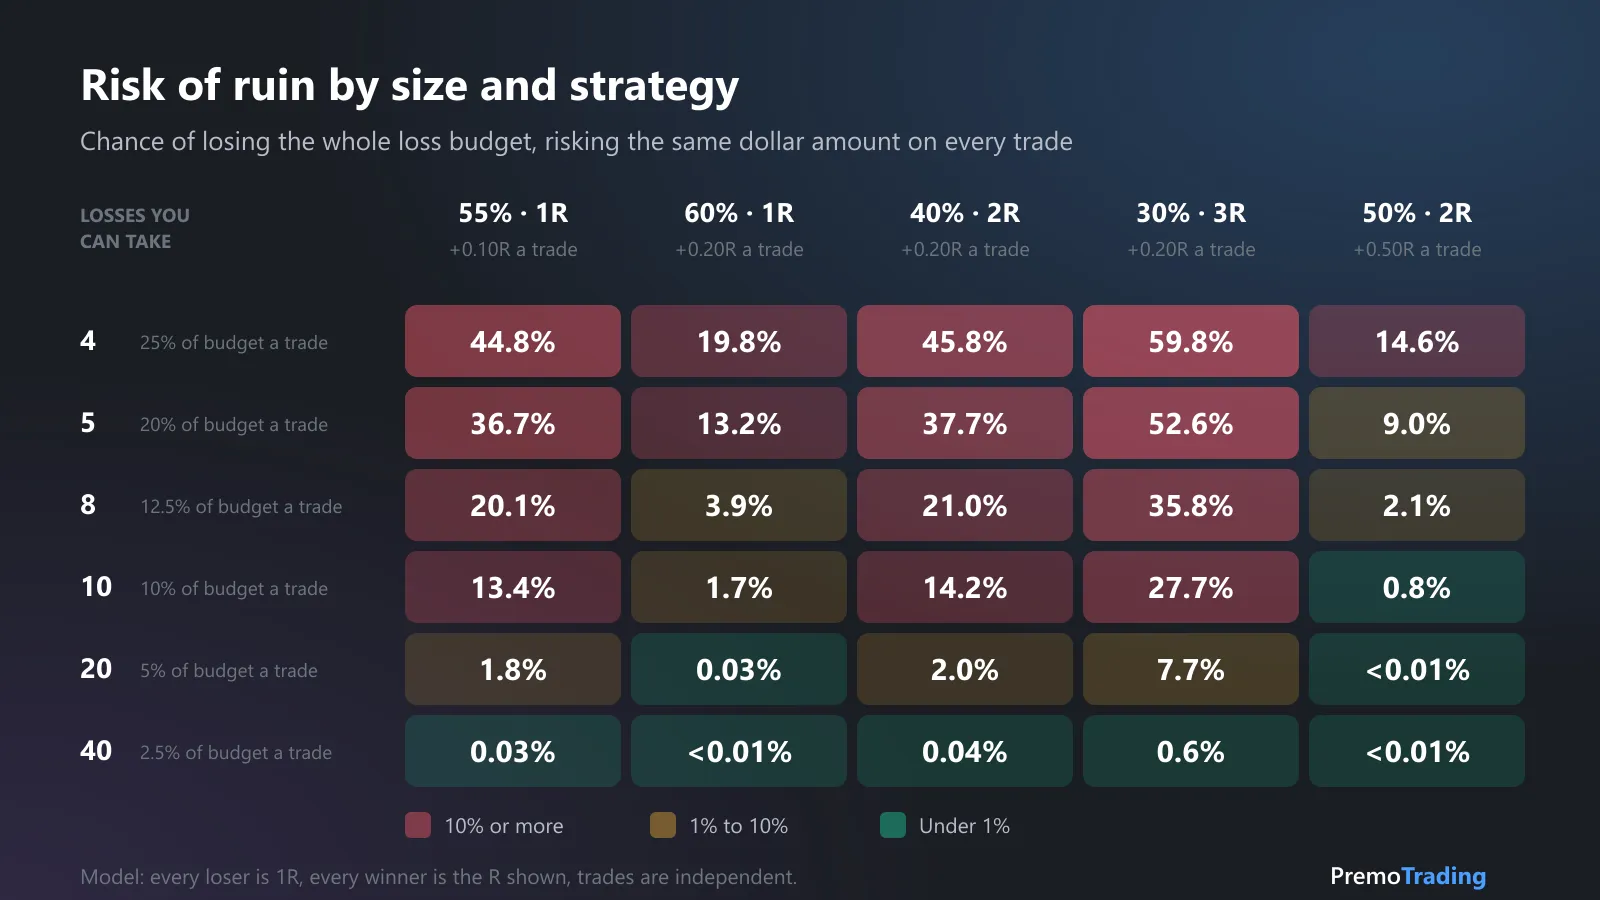
Model: every loser costs 1R, every winner makes the R shown, trades are independent, and you keep trading indefinitely.
Three things stand out:
- Size matters more than the strategy. Going from room for 5 losses to room for 20 cuts the 40% win, 2R strategy’s risk from 37.7% to 2.0%. Nothing about the trades changed.
- Expectancy isn’t the whole story. The three middle columns all make 0.2R a trade. At room for 10 losses, their risk of ruin is 1.7%, 14.2% and 27.7%. A low win rate means longer losing streaks, and losing streaks are what end accounts.
- The curve is steep. Each extra loss you make room for multiplies the risk by the same factor, so small cuts in size have large effects.
The middle columns are a reminder that the risk-reward ratio and expectancy describe the average trade. Risk of ruin describes the path.
Can a profitable strategy still be ruined?
Yes. Positive expectancy lowers the risk of ruin, and it never brings it to zero. Every cell in the table above belongs to a profitable strategy.
The reverse is stricter. A 2R strategy breaks even at a 33.3% win rate. At that win rate or below, the risk of ruin is 100% at any size: smaller trades only make it take longer. That matches Sigman’s result for even bets.
How long a losing streak should you expect?
Longer than most traders plan for. We calculated the chance of at least one losing streak of a given length somewhere in 100 trades, assuming each trade is independent.
| Losing streak of at least | 30% win rate | 40% win rate | 50% win rate | 60% win rate |
|---|---|---|---|---|
| 5 trades | 99.9% | 97.6% | 81.0% | 45.9% |
| 6 trades | 99.0% | 87.3% | 54.6% | 21.2% |
| 8 trades | 85.8% | 49.0% | 17.0% | 3.6% |
| 10 trades | 58.0% | 20.5% | 4.4% | 0.6% |
At a 40% win rate, eight losses in a row is a coin flip over 100 trades. It isn’t evidence that the strategy stopped working. If eight losses would take you through your floor, the size is too big for the win rate.
A streak is also where discipline gets tested. Sizing up to win it back cuts the number of losses you have room for at the worst time. Our guide to trading psychology covers that pattern.
What is the risk of ruin on a prop firm account?
On a prop account, ruin is the drawdown limit, and during an evaluation the question becomes: what’s the chance of hitting the floor before the profit target?
Here is a worked example on a generic $50,000 evaluation with a $2,000 maximum drawdown and a $3,000 profit target. Firms set their own numbers and change them, so check your firm’s current rulebook. The strategy is the 40% win, 2R one from the table. Sizes are in Micro E-mini Nasdaq-100 futures (MNQ), worth $2 a point per CME Group’s contract specs, with a 25-point stop: $50 a contract.
| Risk per trade | MNQ contracts | Losses to the floor | Fails, static drawdown | Fails, trailing drawdown | Average trades to a result (trailing) |
|---|---|---|---|---|---|
| $100 | 2 | 20 | 2.0% | 8.3% | 136 |
| $200 | 4 | 10 | 13.6% | 30.9% | 46 |
| $250 | 5 | 8 | 19.5% | 38.1% | 31 |
| $400 | 8 | 5 | 32.7% | 51.0% | 14 |
| $500 | 10 | 4 | 37.5% | 53.5% | 9 |
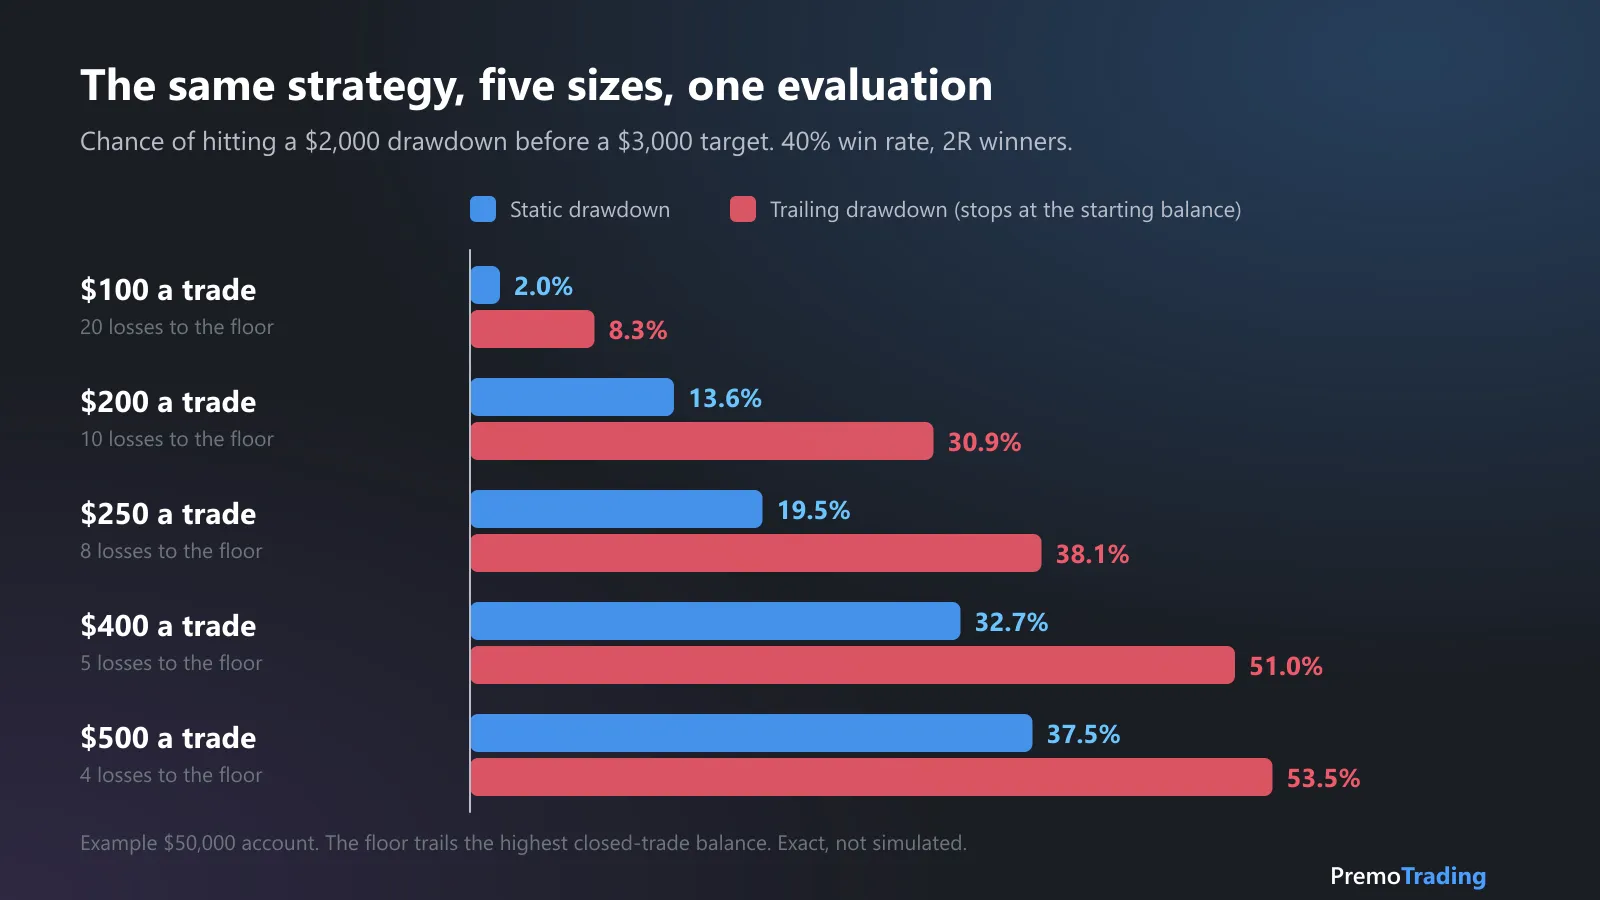
Exact probabilities for the model, not a simulation. Trailing: the floor sits $2,000 below the highest closed-trade balance and stops rising at the starting balance. Touching the floor fails the account.
What the example shows:
- A trailing drawdown takes the room your winners made. With a static floor, a winner adds room. With a trailing floor, it doesn’t until the floor stops moving. At $200 a trade, that turns 13.6% into 30.9%.
- At $400 a trade, a profitable strategy fails more often than it passes on the trailing account.
- Small size costs time. At $100 a trade, the account takes 136 trades on average to pass or fail. That’s the trade-off, and it’s why time limits and monthly fees push traders toward the sizes at the bottom of the table.
An intraday trailing drawdown, which follows open profit as well as closed trades, is harsher than this model. To see where your own floor sits, use the trailing drawdown calculator, and turn a dollar risk into contracts with the futures position size calculator.
How sure are you of your win rate?
Less sure than the formula assumes, and the risk of ruin is very sensitive to it. A win rate of 40% measured over 100 trades has a standard error of about 4.9 percentage points, so the true figure could easily be 36% or 44%.
Here is the 2R strategy again, by true win rate:
| True win rate | Expectancy | Risk of ruin, room for 10 losses | Room for 20 losses |
|---|---|---|---|
| 34% | +0.02R | 81.9% | 67.1% |
| 36% | +0.08R | 45.4% | 20.6% |
| 38% | +0.14R | 25.3% | 6.4% |
| 40% | +0.20R | 14.2% | 2.0% |
| 42% | +0.26R | 8.0% | 0.6% |
| 45% | +0.35R | 3.4% | 0.1% |
Four points of win rate move the risk of ruin from 14.2% to 45.4%. So calculate it with a win rate a few points below the one you measured, and after fees. The same caution applies to profit factor, which needs at least 100 trades before it means much.
What is an acceptable risk of ruin?
There is no official threshold. Trading sites quote different rules of thumb, and they don’t agree with each other.
It’s a trade-off you set. A lower risk of ruin means smaller size, and smaller size means slower progress. Two questions make it concrete:
- What does ruin cost you? Failing a low-cost evaluation and losing your savings are not the same event.
- How many losses in a row should the account absorb? Use the streak table, and leave room for more than the streak you expect.
How do you lower your risk of ruin?
Make room for more losses, or improve the edge. There are four levers, and the first is the largest.
- Risk less per trade. In the main table, the 40% win, 2R strategy goes from 14.2% to 2.0% when the risk per trade is halved.
- Size from the room left. After a drawdown, the same dollar risk is a bigger share of what remains. Recalculate N from where you are, not from where you started.
- Keep losses at 1R. The tables assume every loser costs exactly 1R. A stop that gets moved, or a loss of 2R, uses up two losses of room at once.
- Improve the win rate or the reward-to-risk. Use the sensitivity table: two points of win rate change the answer more than most traders expect. The win rate vs risk-reward calculator shows what each combination is worth.
Risking a fixed percentage of your current balance, instead of a fixed dollar amount, also helps: the dollar risk shrinks as the account does, so the balance never reaches zero in theory. It doesn’t help against a prop floor, which is a fixed number of dollars away.
Is the Kelly criterion the answer?
Not for most day traders. The Kelly criterion is a formula for the bet size that maximizes long-run growth, described by John Kelly at Bell Labs in 1956. For a trade that wins R times its risk, it works out to win rate − (loss rate ÷ R).
For the 40% win, 2R strategy, that’s 0.40 − (0.60 ÷ 2) = 10% of the account on every trade, resized as the balance changes. Wikipedia’s article notes that the criterion is valid only when the probabilities are fully known, which is almost never the case in markets, and that betting more than the Kelly amount increases the risk of ruin. With a measured win rate that could be four points too high, full Kelly is a size to stay well under.
What does the formula leave out?
Real trading is rougher than the model, so treat every figure here as a floor for your own risk.
- Losses vary. Slippage, gaps and moved stops make some losses bigger than 1R.
- Trades aren’t independent. Losses cluster on bad days and in conditions that don’t suit the strategy.
- The edge changes. A win rate measured in one market can fade in the next.
- Fees. Commissions shave every winner and add to every loser.
- You. The model sizes every trade the same. Traders in a drawdown often don’t.
When your wins and losses come in many sizes, a Monte Carlo simulation is the better tool: it draws from your own trade results thousands of times and counts how often the account reaches the floor.
How Premo helps
Premo Trading doesn’t print a risk of ruin figure. It gives you the inputs, measured from your imported trades:
- Win rate, average win, average loss, Risk:Reward and expectancy in Performance Analytics, gross or net of fees.
- Max drawdown and average trades to recover on the equity curve, so you can compare the drawdowns you’ve had with the room you have. Our guide to maximum drawdown shows how deep the next one could go.
- Without the outliers. Leave out your biggest winners and losers, and every statistic recalculates. If your win rate or R:R depends on two trades, use the lower numbers in the tables above. Our guide to trading without P&L outliers explains the check.
Take your win rate and Risk:Reward from there, find the nearest column in the table, and count how many losses your account has room for.
Sources
- Karl Sigman, Columbia University: Gambler’s Ruin Problem (lecture notes, 2009): the ruin probability (q ÷ p)^i, and certain ruin unless the odds are better than fair. Read November 13, 2026.
- Wikipedia: Gambler’s ruin: the history of the problem from Pascal’s 1656 letter. Read November 13, 2026.
- Wikipedia: Kelly criterion: the formula, its 1956 origin and its limits. Read November 13, 2026.
- CME Group: Micro E-mini Nasdaq-100 contract specs: MNQ is $2 per index point. Read November 13, 2026.
This article is educational and is not investment advice. The strategies, probabilities and results shown are examples from a simplified model, not recommendations, forecasts or actual results. Trading futures involves substantial risk of loss.
Frequently asked questions
What is risk of ruin in trading?
Risk of ruin is the probability that a run of losses takes your account down to a level where you have to stop trading, before your edge has time to work. It depends on three things: your win rate, the size of your winners against your losers, and how much of the account you risk on each trade.
How do you calculate risk of ruin?
When winners and losers are the same size, risk of ruin is (loss rate ÷ win rate) raised to the number of losses your account can take. A 55% win rate with room for 10 losses gives (0.45 ÷ 0.55)^10 = 13.4%. When winners are bigger than losers, you need a longer formula, a table or a simulation.
What is an acceptable risk of ruin?
There is no official number. Trading sites quote different rules of thumb, and they don't agree with each other. A lower figure costs you speed, because it means smaller size. Decide how many losing trades you want room for, then check the result against your measured win rate and reward-to-risk.
Can a profitable strategy still have a risk of ruin?
Yes. A strategy with a 40% win rate and winners twice the size of losers makes 0.2R a trade on average. Risk a quarter of your loss budget on each trade and it still loses the whole budget 45.8% of the time. Positive expectancy tells you the average. Size decides whether you survive to earn it.
How does risk of ruin apply to a prop firm account?
On a prop account, ruin is the drawdown limit, not the account balance. A $50,000 account with a $2,000 drawdown is a $2,000 account for this calculation. Divide the room to the floor by your risk per trade to get the number of losses you can take, and use that number in the formula or the tables.
Does a smaller risk per trade always lower risk of ruin?
For a strategy with positive expectancy, yes: halving your risk per trade doubles the number of losses you can take, and risk of ruin falls quickly as that number grows. For a strategy with zero or negative expectancy, no size helps. Smaller trades only make the account last longer before it runs out.