
Maximum drawdown in trading: how to calculate and read it
Maximum drawdown in trading explained: the formula, a 12-trade MNQ example, dollars vs percent, recovery math, and how deep your next drawdown may go.
Maximum drawdown is the largest fall in your account, or your running P&L, from a peak to the lowest point before a new peak. You calculate it by tracking the highest equity so far, subtracting current equity after every trade and keeping the biggest gap. It shows how deep your worst losing stretch went.
Maximum drawdown in trading is the number most traders check after net P&L, and the one most often misread. A single figure can’t tell you whether that drawdown was bad luck, a broken strategy or a size that was too big for the strategy.
This guide covers the formula, a 12-trade MNQ example you can rebuild in a spreadsheet, whether to measure it in dollars or percent, the recovery math, and a question the usual definitions skip: how deep your next drawdown is likely to go. We simulated the answer, and the method is given under each table.
Key takeaways
- Max drawdown is peak to trough, not your biggest loss. It adds up a whole losing stretch.
- For fixed-size futures traders, dollars and R beat percent. A percentage depends on what you divide by.
- Recovery is measured in trades. Drawdown ÷ expectancy per trade is the average number of trades it takes to make it back.
- Your worst drawdown so far is not your worst drawdown. In our simulation, a strategy with a median max drawdown of 13R over 250 trades reached 24R or more one time in 20.
- Read it with the other numbers: expectancy, how long the drawdown lasted, and how often you’ve been near it.
What is maximum drawdown in trading?
Maximum drawdown (MDD) is the biggest peak-to-trough drop in an equity curve over a period, before a new high is made. Wikipedia’s article on drawdown defines a drawdown as the decline from a historical peak in a variable such as cumulative profit, and the maximum drawdown as the largest of those declines over the history.
Three terms are worth keeping apart:
- Drawdown is how far you are below your highest point right now. It’s zero at every new high.
- Maximum drawdown is the deepest drawdown in the period you’re looking at.
- Drawdown duration is how long it takes to get from one high to the next. A shallow drawdown that lasts three months can be harder to trade through than a deep one that’s over in a week.
A drawdown is not the same as a loss. A trader who is up $3,000 for the month and then gives back $1,000 is still profitable, but has a $1,000 drawdown.
How do you calculate maximum drawdown?
Keep a running peak of your equity, subtract the current equity from it after every trade, and take the largest result.
Drawdown at a trade = running peak − current equity
Maximum drawdown = the largest drawdown in the period
Maximum drawdown % = (peak − trough) ÷ peak
The percentage version needs a balance to divide by, which is why it’s used for accounts and funds. More on that below.
To calculate it in Excel or Google Sheets from a list of closed trades:
- Put each trade’s net P&L in column B, in the order the trades closed.
- In column C, the running P&L:
=SUM(B$2:B2), filled down. - In column D, the running peak:
=MAX(0, MAX(C$2:C2)), filled down. The 0 treats the start as the first peak. - In column E, the drawdown:
=D2-C2, filled down. - Max drawdown is
=MAX(E:E). The row where it occurs is the trough.
Use net P&L if you want the figure after commissions and fees, which is the version your account balance feels.
A worked example: 12 MNQ trades
Here are 12 trades in Micro E-mini Nasdaq-100 futures (MNQ). CME Group’s contract specs put MNQ at $2 times the Nasdaq-100 index, so a point is worth $2 a contract. Each trade uses 2 contracts and a 25-point stop, so the risk per trade (1R) is $100. Winners make $200 (2R). Fees are left out to keep the arithmetic clean.
| Trade | P&L | Running P&L | Running peak | Drawdown |
|---|---|---|---|---|
| 1 | +$200 | $200 | $200 | $0 |
| 2 | −$100 | $100 | $200 | $100 |
| 3 | +$200 | $300 | $300 | $0 |
| 4 | +$200 | $500 | $500 | $0 |
| 5 | −$100 | $400 | $500 | $100 |
| 6 | −$100 | $300 | $500 | $200 |
| 7 | −$100 | $200 | $500 | $300 |
| 8 | −$100 | $100 | $500 | $400 |
| 9 | +$200 | $300 | $500 | $200 |
| 10 | −$100 | $200 | $500 | $300 |
| 11 | +$200 | $400 | $500 | $100 |
| 12 | +$200 | $600 | $600 | $0 |
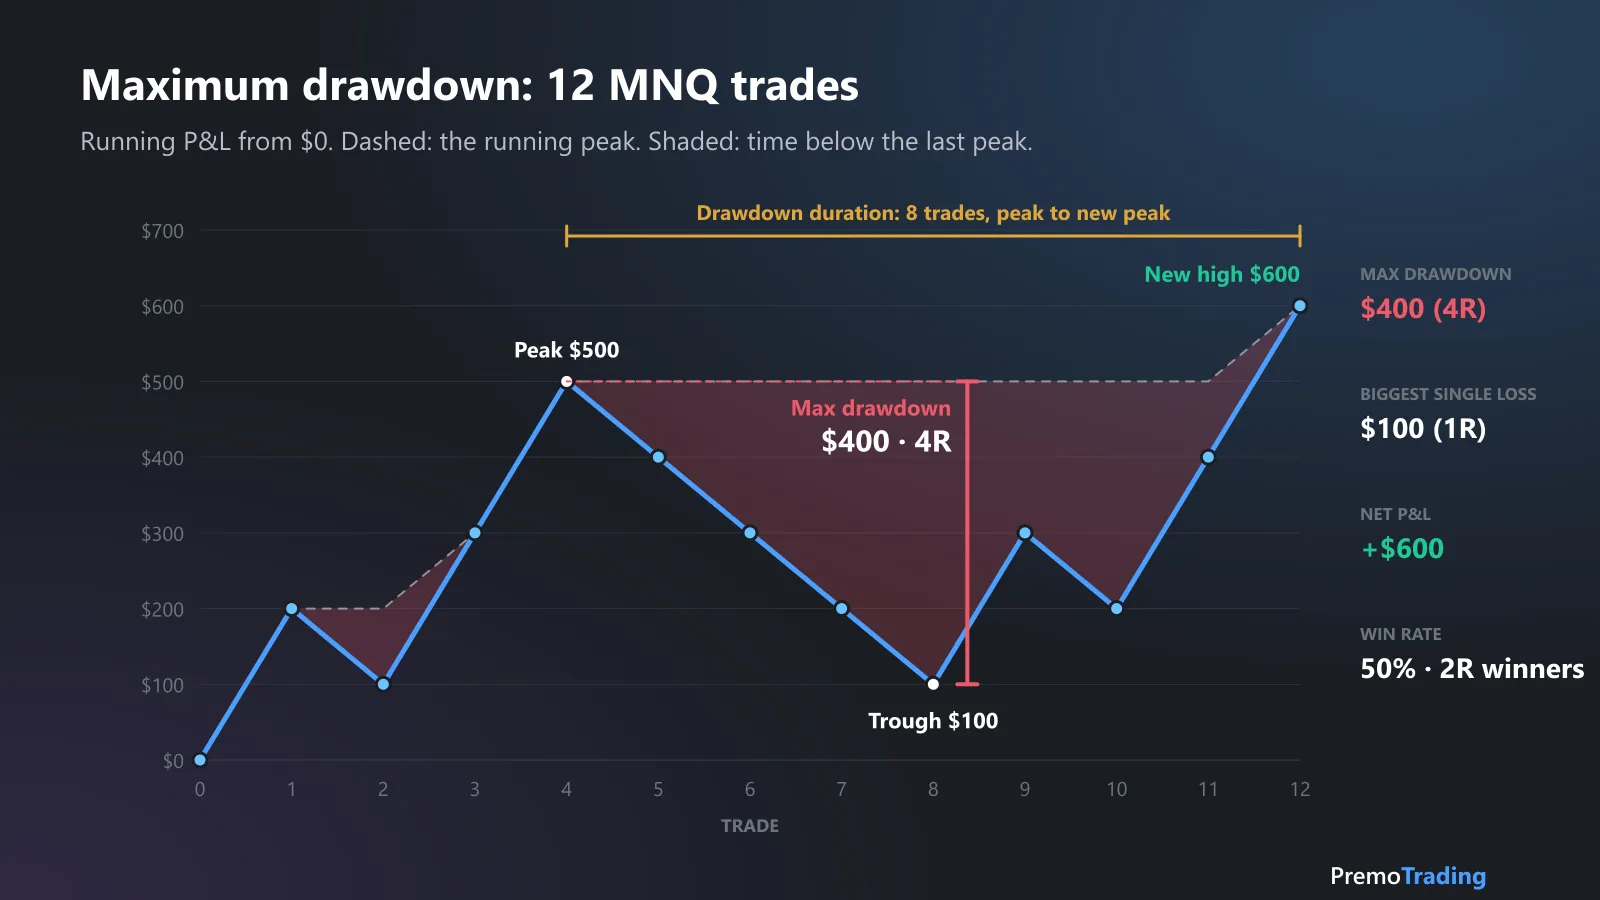
Running P&L from $0, one point per closed trade. Shaded: time below the last peak.
What the table shows:
- Max drawdown: $400, from the $500 peak after trade 4 to the $100 trough after trade 8. That’s 4R.
- Biggest single loss: $100. The drawdown is four times the largest loss, because it’s a stretch of losses, not one trade.
- Two drawdowns, not one. The first ($100) was over in one trade. The second took 8 trades to get from peak to new peak.
- Net result: +$600 with a 50% win rate and 2R winners. A profitable run still had a 4R drawdown in the middle.
Should you measure drawdown in dollars or percent?
If you trade a fixed number of contracts, measure it in dollars and in R. Percent is right for accounts that compound, and misleading for most other uses.
The same $400 drawdown gives very different percentages depending on what you divide by:
| Divide by | Calculation | Max drawdown |
|---|---|---|
| Risk per trade (R) | $400 ÷ $100 | 4R |
| Peak account balance ($50,000 start) | $400 ÷ $50,500 | 0.8% |
| Peak running P&L | $400 ÷ $500 | 80% |
The 80% looks alarming and the 0.8% looks harmless, and they describe the same four losing trades. Deposits and withdrawals move percentages too. A withdrawal at the peak can make the next drawdown look deeper than it was.
R doesn’t have that problem. “My worst drawdown was 4R” means the same thing at any account size, and you can compare it straight to your risk per trade and your loss limits.
How much do you need to make back after a drawdown?
Drawdown recovery in dollars takes exactly what you lost. In percent, more than you lost, because the gain is measured on a smaller balance. If your size is a fixed dollar amount, think of recovery in trades rather than percentages.
When your size is a share of the balance, the gain needed is drawdown ÷ (1 − drawdown):
| Drawdown | Gain needed to get back |
|---|---|
| 5% | 5.3% |
| 10% | 11.1% |
| 20% | 25.0% |
| 30% | 42.9% |
| 50% | 100.0% |
Most futures day traders don’t size that way. They trade 2 MNQ, or 1 ES, whatever the balance. For them, a $400 drawdown takes $400 to recover, and the useful question is how many trades that is:
Trades to recover ≈ drawdown ÷ expectancy per trade
The example strategy (50% win rate, 2R winners) makes 0.5R, or $50, a trade on average, so a $400 drawdown takes about 8 trades. A strategy that makes $20 a trade needs about 20. Our guide to expectancy shows how to measure that figure. It’s an average: a lucky streak can do it in four trades, and a cold one can take sixty.
That’s also why a small edge and a deep drawdown are a hard pair. The lower your expectancy, the longer every drawdown lasts.
How big will your next max drawdown be?
Probably bigger than your worst one so far. Max drawdown keeps growing as you take more trades, because every extra trade is another chance for a long losing streak. Wikipedia’s drawdown article, citing a 2004 paper by Magdon-Ismail, Atiya, Pratap and Abu-Mostafa in the Journal of Applied Probability, notes that for a random walk with a positive drift, the expected maximum drawdown grows with the logarithm of time. With no drift it grows with the square root of time, and with a negative drift it grows in a straight line.
To put numbers on it, we simulated three strategies that each make 0.2R a trade, 200,000 times each:
| Trades | 60% · 1R: median | 60% · 1R: 95th | 40% · 2R: median | 40% · 2R: 95th | 30% · 3R: median | 30% · 3R: 95th |
|---|---|---|---|---|---|---|
| 50 | 4R | 9R | 7R | 15R | 10R | 19R |
| 100 | 6R | 11R | 10R | 19R | 13R | 25R |
| 250 | 8R | 13R | 13R | 24R | 18R | 33R |
| 500 | 9R | 15R | 16R | 28R | 22R | 40R |
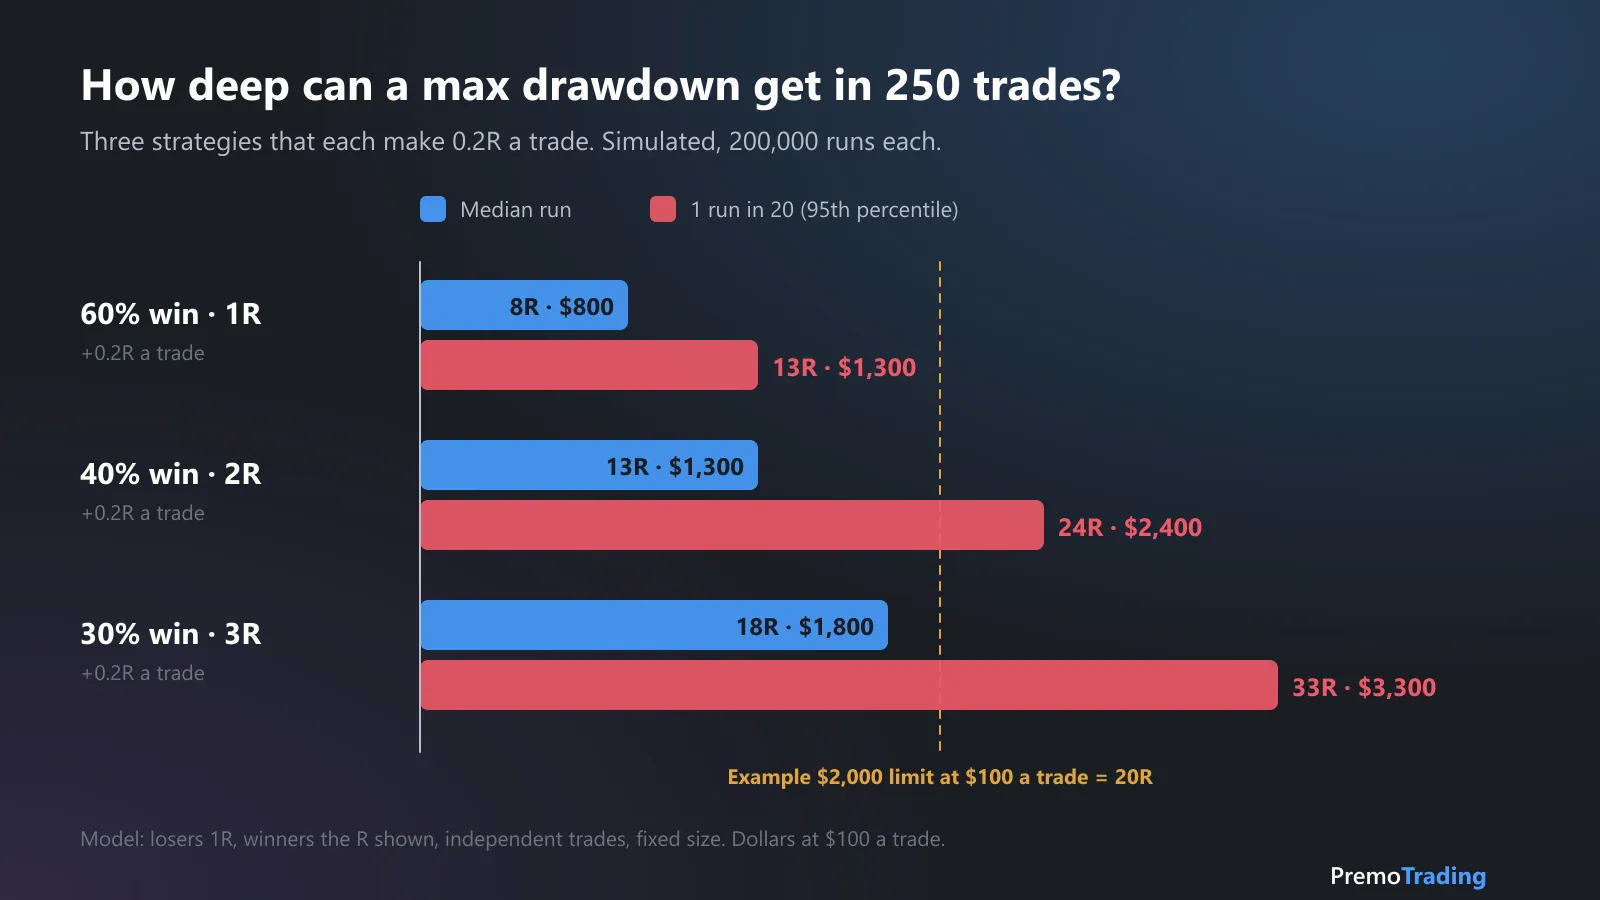
Model: every loser costs 1R, every winner makes the R shown, trades are independent, fixed size. Drawdown is measured from $0 and from every later peak. 200,000 runs per cell.
Three things stand out:
- The bad case is well beyond the typical case. Across the table, the 95th percentile is 1.6 to 2.3 times the median.
- Lower win rates mean deeper drawdowns at the same expectancy. Over 250 trades, the 30% strategy’s median drawdown is more than twice the 60% strategy’s.
- The underwater stretches are long. Over 250 trades, the longest stretch spent below the last peak had a median length of 37 trades at a 60% win rate, 58 at 40% and 70 at 30%.
Now put a prop firm limit on it. On a generic evaluation with a $2,000 drawdown limit, trading $100 a trade gives you 20R of room. Over 250 trades, a drawdown of 20R or more from a peak, which is what a floor trailing your closed-trade high would measure, showed up in 0.4% of runs at a 60% win rate, 14.6% at 40% and 41.1% at 30%. Same expectancy, very different odds. Our guide to risk of ruin works through the chance of hitting a floor before a profit target.
What is a good maximum drawdown?
There’s no standard number. A good max drawdown is one that fits inside your limits with room to spare, measured against your own risk per trade and expectancy.
Check yours in four steps:
- Convert it to R. Max drawdown ÷ risk per trade. If you can’t, your risk per trade isn’t consistent, which is a finding of its own.
- Compare it with your limits. Daily, weekly and account loss limits, or the prop firm’s drawdown rule. Firms set their own numbers and change them, so check your firm’s current rulebook.
- Assume the next one is deeper. Use the simulation table: if your max drawdown is near the median for your strategy, one up to the 95th percentile, 1.6 to 2.3 times as deep, is still within normal luck.
- Resize if it doesn’t fit. Fewer contracts per trade is the only lever that changes the drawdown without changing the strategy. The futures position size calculator turns a dollar risk into contracts.
A drawdown much deeper than your strategy’s 95th percentile deserves a closer look: moved stops, oversized trades or trades outside your setups. Our list of common trading mistakes covers the usual suspects.
How is max drawdown different from a prop firm’s drawdown rule?
Max drawdown is a statistic about your past trades. A prop firm’s maximum drawdown is a rule: a balance floor that ends the account if you touch it.
The difference matters in two ways:
- The floor can move. A trailing drawdown follows your highest balance up, sometimes including open profit, until it stops at a level the firm sets. Your own max drawdown statistic doesn’t care about that.
- The rule is checked live. A trade that dips $600 against you and closes at a $100 loss shows a $100 drop on a closed-trade equity curve. An intraday rule may have counted the $600.
So keep a gap between your measured max drawdown and the firm’s limit, and use the trailing drawdown calculator to see where your floor sits.
What does maximum drawdown leave out?
A lot. It’s one number from one event in one sample, so read it next to the figures that fill in the rest.
- How often. Two strategies with a $1,000 max drawdown aren’t the same if one has been within $200 of it ten times.
- How long. Duration often hurts more than depth. Track the longest time between new highs.
- What you made for it. The Calmar ratio, introduced by Terry W. Young in the trade journal Futures in 1991, divides the average annual return over the last 36 months by the maximum drawdown over the same 36 months, according to Wikipedia’s article on the ratio. For a day trader, net P&L ÷ max drawdown over the same period gives a similar read: how many drawdowns’ worth you made. The Sharpe ratio measures return against day-to-day swings instead.
- Outliers. One oversized loss can set your max drawdown for the year. Check the number with the extremes left out too, as in Base hits or home runs?
- The sample. Your history is one path out of many the same strategy could have taken. Like profit factor, it needs a large number of trades before it means much.
How Premo helps
Premo Trading works out max drawdown from the trades you import and shows the drawdowns themselves, not just the number:
- The Equity Curve card in Performance Analytics draws your running P&L from $0 over the range you pick. Drawdowns are shaded and the deepest low is marked.
- Max drawdown and average trades to recover, gross or net of commission and exchange fees.
- Per trade or per day. The per-day view shows one step per trading day, so a dip inside a day doesn’t show on the line, but the Max Drawdown figure still counts every trade.
- Exclude outliers. Leave out your biggest winners and losers and every statistic recalculates, so you can see whether one trade set your max drawdown.
Take your max drawdown and your average loss from there, express the drawdown in R, and compare it with the simulation table above.
Sources
- Wikipedia: Drawdown (economics): definitions of drawdown, maximum drawdown and drawdown duration, and how expected maximum drawdown grows with time (Magdon-Ismail et al., 2004). Read November 15, 2026.
- Wikipedia: Calmar ratio: Terry W. Young’s 1991 return-to-drawdown measure. Read November 15, 2026.
- CME Group: Micro E-mini Nasdaq-100 contract specs: MNQ is $2 times the Nasdaq-100 index. Read November 15, 2026.
This article is educational and is not investment advice. The trades, strategies and simulated results shown are examples, not recommendations, forecasts or actual results. Trading futures involves substantial risk of loss.
Frequently asked questions
What is maximum drawdown in trading?
Maximum drawdown is the largest drop in your account balance or running P&L from a peak to the lowest point before a new peak. It measures the worst losing stretch in a period, in dollars or as a percentage of the peak. It says nothing about how often drawdowns happen or how long they last.
How do you calculate maximum drawdown?
After every trade, record your running P&L and the highest value it has reached so far. Subtract the current value from that peak to get the drawdown at that trade. The largest of those numbers is your maximum drawdown. Divide it by the account balance at the peak if you want it as a percentage.
What is a good maximum drawdown for a day trader?
There is no standard figure. Judge it against your risk per trade and your limits instead. Divide your max drawdown by the dollars you risk per trade to get it in R, then check that a deeper one than you've had still fits inside your daily, weekly or prop firm loss limit.
Is maximum drawdown the same as the biggest loss?
No. Your biggest loss is one trade. Maximum drawdown is the sum of a losing stretch, measured from the high point before it to the low point inside it, so it can include winners along the way. In our 12-trade example the biggest loss is $100 and the max drawdown is $400.
How long does it take to recover from a drawdown?
On average, about the drawdown divided by your expectancy per trade. A $400 drawdown with an expectancy of $20 a trade takes around 20 trades to make back, though luck can make it much faster or slower. If your size is a percentage of the balance, you need a bigger percentage gain than you lost.