
Sharpe ratio for traders: formula, example and limits
The Sharpe ratio for traders: the formula on daily P&L, a 20-day MNQ example, annualizing with √252, Sortino, and how many days it takes to mean something.
The Sharpe ratio is your average return, minus a risk-free rate, divided by the standard deviation of those returns. For a day trader it’s usually worked out on daily P&L and then annualized by multiplying by √252. A higher number means you made more for each dollar of day-to-day swing in your results.
The Sharpe ratio is borrowed from fund management, where it compares portfolios over years of monthly returns. Day traders use it on a few weeks of daily P&L, and that’s where it starts to mislead.
This guide covers the formula, a 20-day MNQ example you can rebuild in a spreadsheet, whether to subtract the risk-free rate, the Sortino ratio, and the question most explanations skip: how many trading days it takes before your Sharpe ratio means anything. We simulated the answer, and the model is given under the table.
Key takeaways
- Sharpe = average daily P&L ÷ standard deviation of daily P&L, times √252 to put it in annual terms.
- Use daily P&L, not per-trade P&L, if you’re going to annualize with √252.
- For futures, the risk-free rate matters less than for a stock account, because your P&L is already close to an excess return.
- Sortino counts only the bad days, so it doesn’t treat a big winning day as risk.
- A short sample proves very little. In our simulation, a strategy with no edge at all showed a Sharpe ratio of 3.89 or more in 14% of 20-day samples.
What is the Sharpe ratio?
The Sharpe ratio is a measure of risk-adjusted return: the average excess return per unit of volatility. William F. Sharpe introduced it in 1966 as the “reward-to-variability” ratio, and his 1994 article in the Journal of Portfolio Management, titled “The Sharpe Ratio”, adopted the name it had picked up in the meantime.
In that article, the ratio is the mean of a differential return divided by its standard deviation. The differential return is your return minus a benchmark’s return, which Sharpe originally took to be a riskless security. For a trader today, that means something like a Treasury bill.
Two terms come up again and again:
- Excess return is what you made above the risk-free rate.
- Standard deviation measures how widely your results spread around their average. Two traders can both average $40 a day, one with a narrow spread and one with a wide one.
The ratio rewards the narrow spread. That’s its strength and, as you’ll see below, its main weakness.
What is the Sharpe ratio formula?
Sharpe ratio = (average return − risk-free return) ÷ standard deviation of returns
For a day trader working from daily P&L in dollars, the version most people use is:
Daily Sharpe = average daily P&L ÷ standard deviation of daily P&L
Annualized Sharpe = daily Sharpe × √252
The √252 comes from the number of trading days in a year. The NYSE holiday calendar shows 10 full-day closures in 2026, which leaves 251 trading days, and 252 is the usual round number. The square root is there because, if days are independent, the average grows with the number of days and the standard deviation grows with its square root. Sharpe’s 1994 paper sets out that rule and notes it assumes zero serial correlation.
How do you calculate the Sharpe ratio from your trades?
Total each day’s trades into one daily P&L figure, then run the formula on the daily figures.
To calculate it in Excel or Google Sheets:
- Put each trading day’s net P&L in column B, one row per day, oldest first. Use net P&L if you want the figure after commissions and fees.
- Average daily P&L:
=AVERAGE(B2:B21) - Standard deviation:
=STDEV.S(B2:B21) - Daily Sharpe:
=AVERAGE(B2:B21)/STDEV.S(B2:B21) - Annualized Sharpe:
=AVERAGE(B2:B21)/STDEV.S(B2:B21)*SQRT(252)
Sharpe’s paper gives the same spreadsheet approach, an average divided by a standard deviation.
Decide up front what to do with days you didn’t trade. If you skipped a day by choice, a $0 belongs in the list. If the market was closed, it doesn’t. Whatever you choose, keep it the same every time you compare.
Why not per trade? You can divide average trade P&L by its standard deviation, and it’s a fair way to compare setups. But annualizing it with √252 is wrong unless you take exactly one trade a day, because the 252 counts days, not trades.
A worked example: 20 days of MNQ
Here are 20 trading days from a trader in Micro E-mini Nasdaq-100 futures (MNQ). CME Group sets MNQ at $2 times the Nasdaq-100 index, so on 2 contracts each point is worth $4. Every figure is the day’s net P&L.
| Day | P&L | Day | P&L | Day | P&L | Day | P&L |
|---|---|---|---|---|---|---|---|
| 1 | +$180 | 6 | +$60 | 11 | +$40 | 16 | +$70 |
| 2 | −$120 | 7 | −$80 | 12 | −$260 | 17 | −$40 |
| 3 | +$90 | 8 | +$150 | 13 | +$120 | 18 | +$260 |
| 4 | +$240 | 9 | +$310 | 14 | +$200 | 19 | −$110 |
| 5 | −$200 | 10 | −$150 | 15 | −$90 | 20 | +$130 |
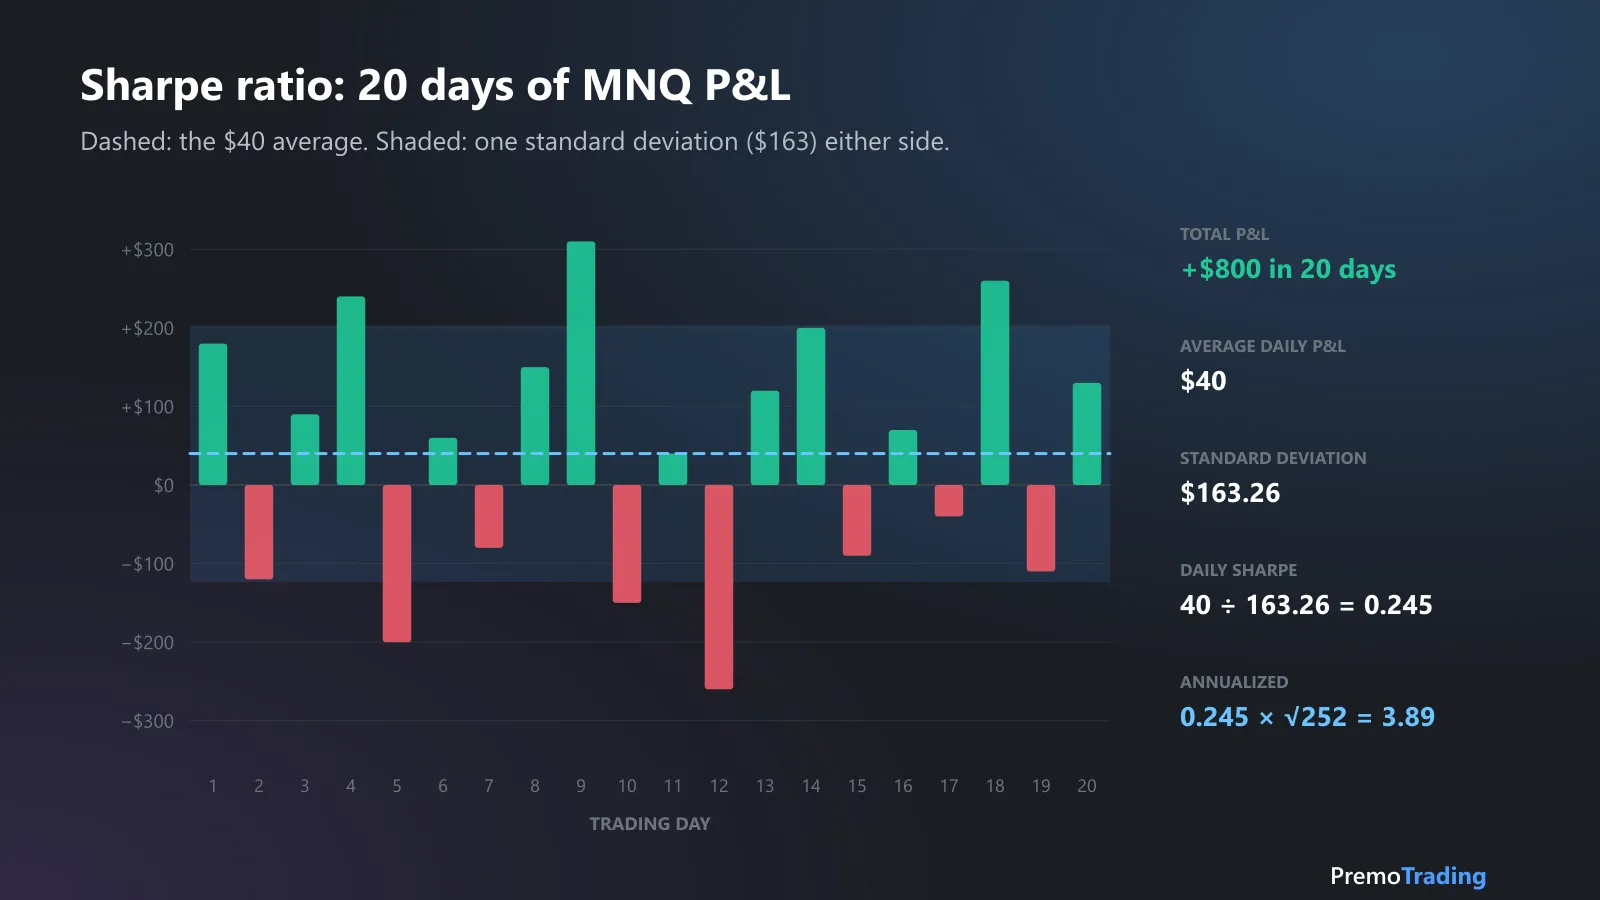
Daily net P&L. Dashed: the $40 average. Shaded: one standard deviation either side.
The arithmetic:
| Step | Calculation | Result |
|---|---|---|
| Total P&L | 12 green days, 8 red days | +$800 |
| Average daily P&L | $800 ÷ 20 | $40 |
| Standard deviation | STDEV.S of the 20 days |
$163.26 |
| Daily Sharpe | $40 ÷ $163.26 | 0.245 |
| Annualized Sharpe | 0.245 × √252 (15.87) | 3.89 |
An annualized Sharpe ratio of 3.89 looks exceptional. For scale, Sharpe’s 1994 paper puts a leveraged position in a developed stock market at about 0.40 a year, from a 6% excess return and 15% standard deviation. Before reading too much into 3.89, look at the section on sample size below. Twenty days is a very short record.
Should day traders subtract the risk-free rate?
For futures, it matters less than for a stock account, but subtracting it is the more honest version. The risk-free rate is the return you could get with no risk, usually a short-term Treasury bill.
Sharpe’s paper describes the differential return as a zero-investment strategy: long one thing, short another. A futures position is close to that already. You post margin instead of paying for the contract, and your cash can earn interest at the same time. So your futures P&L is roughly an excess return before you subtract anything.
If you want to subtract it anyway, convert the rate to dollars a day on your account:
- The 3-month Treasury bill rate was 4.14% on November 12, 2026, in the Federal Reserve’s H.15 data published on FRED (series DTB3, discount basis).
- On a $50,000 account: $50,000 × 4.14% ÷ 252 = $8.21 a day.
- New average: $40 − $8.21 = $31.79. New annualized Sharpe: $31.79 ÷ $163.26 × 15.87 = 3.09.
For a stock trader whose whole account is invested during the day, the same subtraction is the standard method. The bigger the account relative to your daily P&L, the more it moves the result.
Sharpe ratio vs Sortino ratio: which should traders use?
Use both. The Sharpe ratio counts every swing as risk. The Sortino ratio only counts the days that fall below a target, usually $0.
The Sortino ratio divides the average return above the target by the downside deviation. Downside deviation is the square root of the average squared shortfall below the target, with every day at or above it counted as zero. It traces back to work by Frank Sortino, including Sortino and Price’s 1994 article in the Journal of Investing.
In a spreadsheet, with a target of $0:
=AVERAGE(B2:B21)/SQRT(SUMPRODUCT((B2:B21<0)*B2:B21^2)/COUNT(B2:B21))*SQRT(252)
Here’s what one big winning day does to each ratio. We added a 21st day of +$1,200 to the example:
| 20 days | With a +$1,200 day | Change | |
|---|---|---|---|
| Average daily P&L | $40 | $95.24 | +138% |
| Standard deviation | $163.26 | $298.99 | +83% |
| Annualized Sharpe | 3.89 | 5.06 | +30% |
| Downside deviation | $92.92 | $90.69 | −2% |
| Annualized Sortino | 6.83 | 16.67 | +144% |
The Sharpe ratio rose, but the big day also widened the standard deviation, so it gave back much of the gain. Past a certain size, a bigger winning day raises the Sharpe ratio less: in the same test, a +$600 day took it to 5.27 and a +$3,000 day to 4.32.
If your strategy depends on occasional large winners, the Sharpe ratio will understate it. Check how much of your result comes from a few days, as in Base hits or home runs?
How many trading days do you need for a Sharpe ratio?
At least several months. A Sharpe ratio is a statistic estimated from a sample, and with a few weeks of daily P&L the error is bigger than the number.
Andrew Lo made this point in “The Statistics of Sharpe Ratios” (Financial Analysts Journal, July/August 2002): the mean and volatility behind the ratio are estimates, so the ratio carries estimation error. He also showed that annualizing by a square root of time is only right under special conditions, and that serial correlation overstated one hedge fund’s annual Sharpe ratio by as much as 65%.
To see how wide the error is for a day trader, we simulated strategies with a known true Sharpe ratio, 200,000 times each, and measured what a trader would see:
| Trading days | No edge (true 0): 90% range | True 1: 90% range | True 1: shows below 0 | True 2: 90% range | True 2: shows below 0 |
|---|---|---|---|---|---|
| 20 | −6.1 to 6.1 | −5.1 to 7.2 | 39% | −4.0 to 8.3 | 29% |
| 60 | −3.4 to 3.4 | −2.4 to 4.5 | 31% | −1.4 to 5.5 | 17% |
| 120 | −2.4 to 2.4 | −1.4 to 3.4 | 25% | −0.4 to 4.4 | 8% |
| 250 | −1.7 to 1.7 | −0.7 to 2.7 | 16% | 0.3 to 3.7 | 2% |
| 500 | −1.2 to 1.2 | −0.2 to 2.2 | 8% | 0.8 to 3.2 | 0.2% |
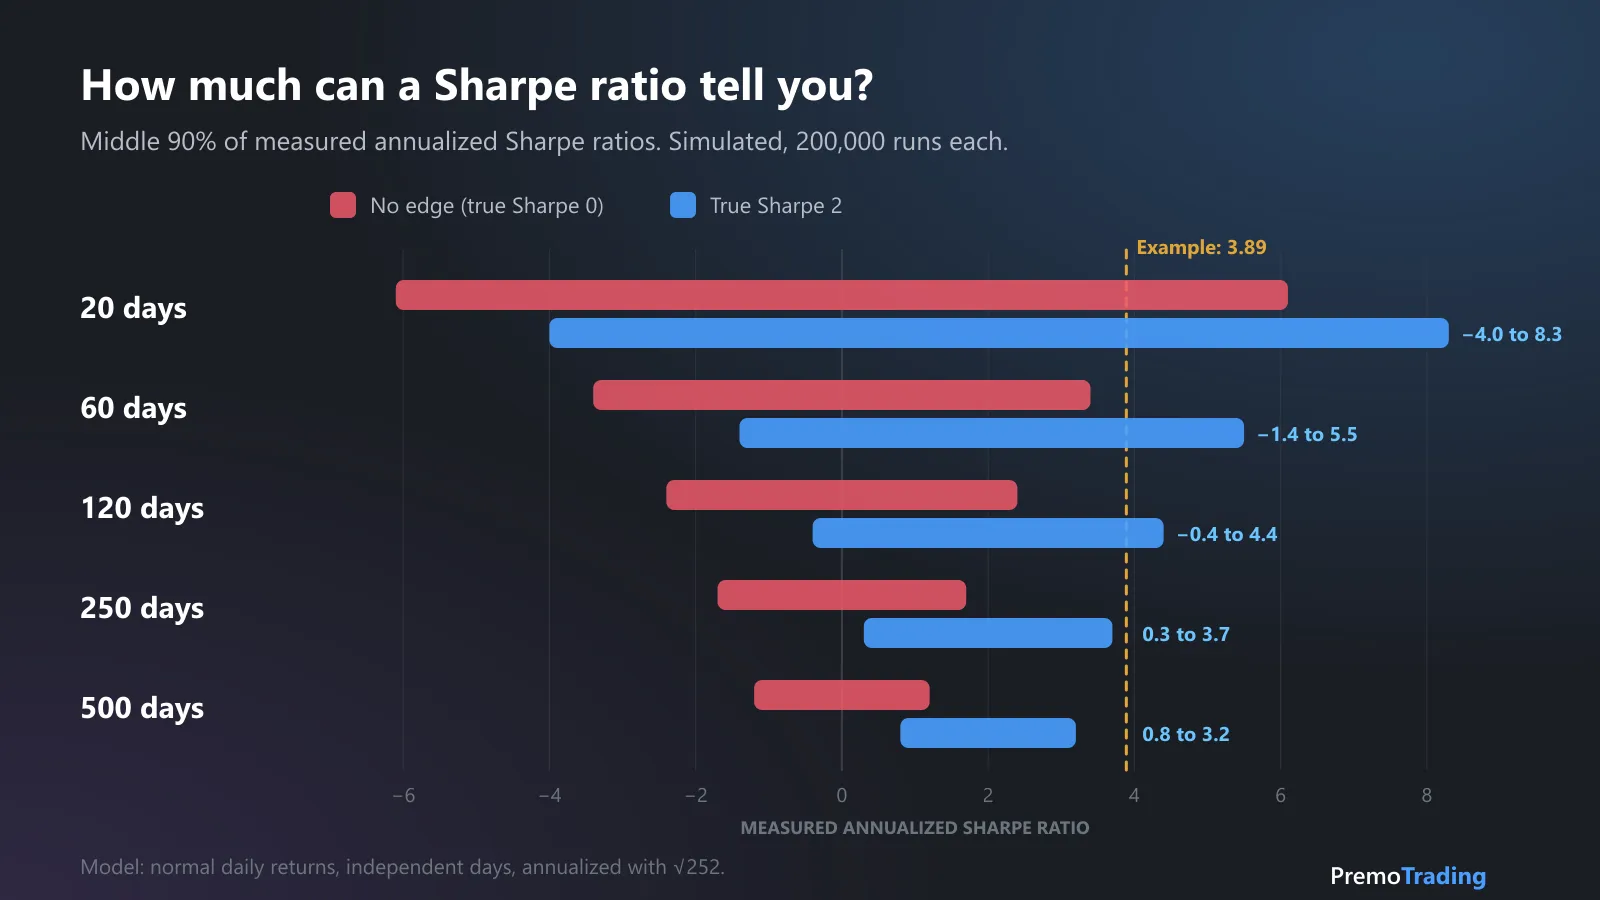
Model: daily returns drawn from a normal distribution with a fixed mean and standard deviation, independent days, annualized with √252. The 90% range runs from the 5th to the 95th percentile. 200,000 runs per cell.
What the table says:
- Twenty days can’t tell an edge from luck. A strategy with no edge showed 3.89 or more, the example’s figure, in 14% of 20-day samples, 3% of 60-day samples and 0.4% of 120-day samples.
- A real edge can look like none. A strategy with a true Sharpe ratio of 2 measured below zero in 29% of 20-day samples.
- It takes about a year to narrow. At 250 days, the true-2 strategy’s 90% range was still 0.3 to 3.7.
Real P&L has fatter tails than a normal distribution, so treat these ranges as the best case.
What is a good Sharpe ratio for a day trader?
There’s no official threshold. A good Sharpe ratio is one that holds up over hundreds of trading days, measured net of fees, and doesn’t depend on a handful of outlier days.
Check yours in four steps:
- Count your days. Under about 120 trading days, read the number as a rough range, using the table above.
- Use net P&L. Commissions and exchange fees come off every day and lower the average without lowering the spread much.
- Run it without your best days. If the ratio collapses, your edge depends on rare events, and the Sortino ratio will tell you more.
- Read it next to dollar figures. A high Sharpe ratio on $10 a day is still $10 a day. Your expectancy per trade and your maximum drawdown say how much you make and how deep the losing stretches go.
What does the Sharpe ratio leave out?
It treats returns as a symmetric bell curve, and trading P&L rarely is one.
- The order of the days. Twenty days of P&L give the same Sharpe ratio in any order. A losing streak that sinks a prop account and the same losses spread out score the same. Your risk of ruin depends on the order.
- Tail risk. A strategy that wins small every day and loses big once a quarter can show a high Sharpe ratio until the big loss arrives.
- Serial correlation. If good days follow good days, √252 overstates the annual figure, as Lo’s paper shows.
- Size changes. If you doubled your contracts halfway through, the daily dollar figures mix two different strategies. Compare in R, or split the period.
Like profit factor, the Sharpe ratio is one summary of a sample. Use it to compare periods or setups on the same footing, not to prove an edge.
How Premo helps
Premo Trading doesn’t print a Sharpe ratio. It gives you the daily figures to calculate one, and the other numbers to read it against:
- The P&L calendar on the Trade Journal lays out each trading day with its P&L, ready to copy into the spreadsheet formula above.
- The equity curve per day in Performance Analytics shows one step per trading day, gross or net of commission and exchange fees.
- Max drawdown, expectancy, R:R and the P&L distribution, so you can see the shape behind your standard deviation.
- Exclude outliers. Leave out your biggest winning and losing trades, and win rate, expectancy, R:R and P&L recalculate: a quick check on whether a few trades carry your results, like step 3 above.
Paste your daily figures into the formulas above, then check how many days they cover against the simulation table. The free expectancy calculator works out the per-trade side of the same picture.
Sources
- William F. Sharpe, “The Sharpe Ratio”, Journal of Portfolio Management, Fall 1994: the 1966 origin, the differential-return definition, the spreadsheet formula, time aggregation and the 0.40 stock market example. Read November 16, 2026.
- Andrew W. Lo, “The Statistics of Sharpe Ratios”, Financial Analysts Journal, 2002: estimation error, annualizing, and the 65% overstatement from serial correlation. Read November 16, 2026.
- Wikipedia: Sortino ratio: definition, downside deviation and Sortino and Price (1994). Read November 16, 2026.
- FRED: 3-Month Treasury Bill Secondary Market Rate (DTB3): 4.14% on November 12, 2026. Read November 16, 2026.
- NYSE: Holidays and trading hours: 2026 market closures. Read November 16, 2026.
- CME Group: Micro E-mini Nasdaq-100 futures: MNQ is $2 times the Nasdaq-100 index. Read November 16, 2026.
This article is educational and is not investment advice. The trades, strategies and simulated results shown are examples, not recommendations, forecasts or actual results. Trading futures involves substantial risk of loss.
Frequently asked questions
What is the Sharpe ratio in trading?
The Sharpe ratio is your average return minus a risk-free rate, divided by the standard deviation of those returns. For a day trader it is usually worked out on daily P&L. It tells you how much you made for each unit of day-to-day swing in your results, so steadier returns score higher than lumpy ones.
How do you calculate a Sharpe ratio from daily P&L?
List your net P&L for each trading day. Divide the average by the sample standard deviation to get the daily Sharpe ratio, then multiply by the square root of 252 to annualize it. In Excel or Google Sheets that is =AVERAGE(B2:B21)/STDEV.S(B2:B21)*SQRT(252) for 20 days in column B.
What is a good Sharpe ratio for a day trader?
There is no official cut-off. For scale, William Sharpe's 1994 paper gives about 0.40 a year for a leveraged stock market index. A day trader's figure over a few weeks is mostly noise: in our simulation, a strategy with no edge showed an annualized Sharpe of 3.89 or more in 14% of 20-day samples.
Should a futures day trader subtract the risk-free rate?
It changes less than you might think. A futures trader posts margin rather than the contract's value, so the P&L is close to an excess return already. Subtracting a 4.14% Treasury bill rate on a $50,000 account takes about $8 a day off the average and lowered our example from 3.89 to 3.09.
What is the difference between the Sharpe and Sortino ratios?
The Sharpe ratio divides by the standard deviation of all returns, so big winning days count as risk. The Sortino ratio divides by downside deviation, which only counts returns below a target such as $0. In our example, one +$1,200 day lifted the Sharpe ratio by 30% and the Sortino ratio by 144%.
How many days of data do you need for a Sharpe ratio?
More than most traders expect. In our simulation of a strategy with a true annualized Sharpe ratio of 2, the measured figure was negative in 29% of 20-day samples, 17% at 60 days and 2% at 250 days. Treat anything under a few months of trading days as a rough guess.