
What is a trading strategy? Definition, 7 parts and an example
A trading strategy is a written set of rules for when to enter, exit and size a trade. Learn its 7 parts, the main types and a full MNQ example you can copy.
A trading strategy is a written set of rules that decides what you trade, when you enter, where you exit and how much you risk - so that the same market picture always leads to the same decision. If two traders could follow your rules and take the same trades, you have a strategy. If the decisions are made in the moment, you have an opinion.
That difference matters more than any indicator. A strategy can be tested, measured and improved, because every trade follows the same rules. An opinion can’t, because every trade is different. This guide covers what a strategy is made of, how it differs from a setup and a trading plan, the main types, a complete example you can copy, and how to tell whether yours actually works.
Key takeaways
- A strategy has seven parts: market and timeframe, edge, setup, entry, stop, target and management, and position size.
- Strategy, setup and plan are different things. A plan holds your strategies; each strategy holds the setups that trigger it.
- Write it so someone else could follow it. Vague rules (“buy strength”) can’t be tested.
- Judge it in R and over enough trades. Expectancy over 50 to 100 trades says more than any single week.
- Test your discipline as well as the rules. A strategy you don’t follow hasn’t been tested.
Trading strategy vs setup vs trading plan
These three words get used interchangeably, and that’s where a lot of confusion starts. They’re three layers of the same thing:
| What it answers | Example | |
|---|---|---|
| Trading plan | How do I run my trading as a business? | MNQ only, 9:30 to 11:30 a.m. ET, 0.5% risk per trade, stop after −3R in a day, review every evening |
| Trading strategy | What is my repeatable way of making money? | Trend continuation: buy pullbacks in an uptrend, with fixed stop, target and size rules |
| Setup | What exactly does the chart need to show? | A pullback touches a rising VWAP and a candle closes back above it |
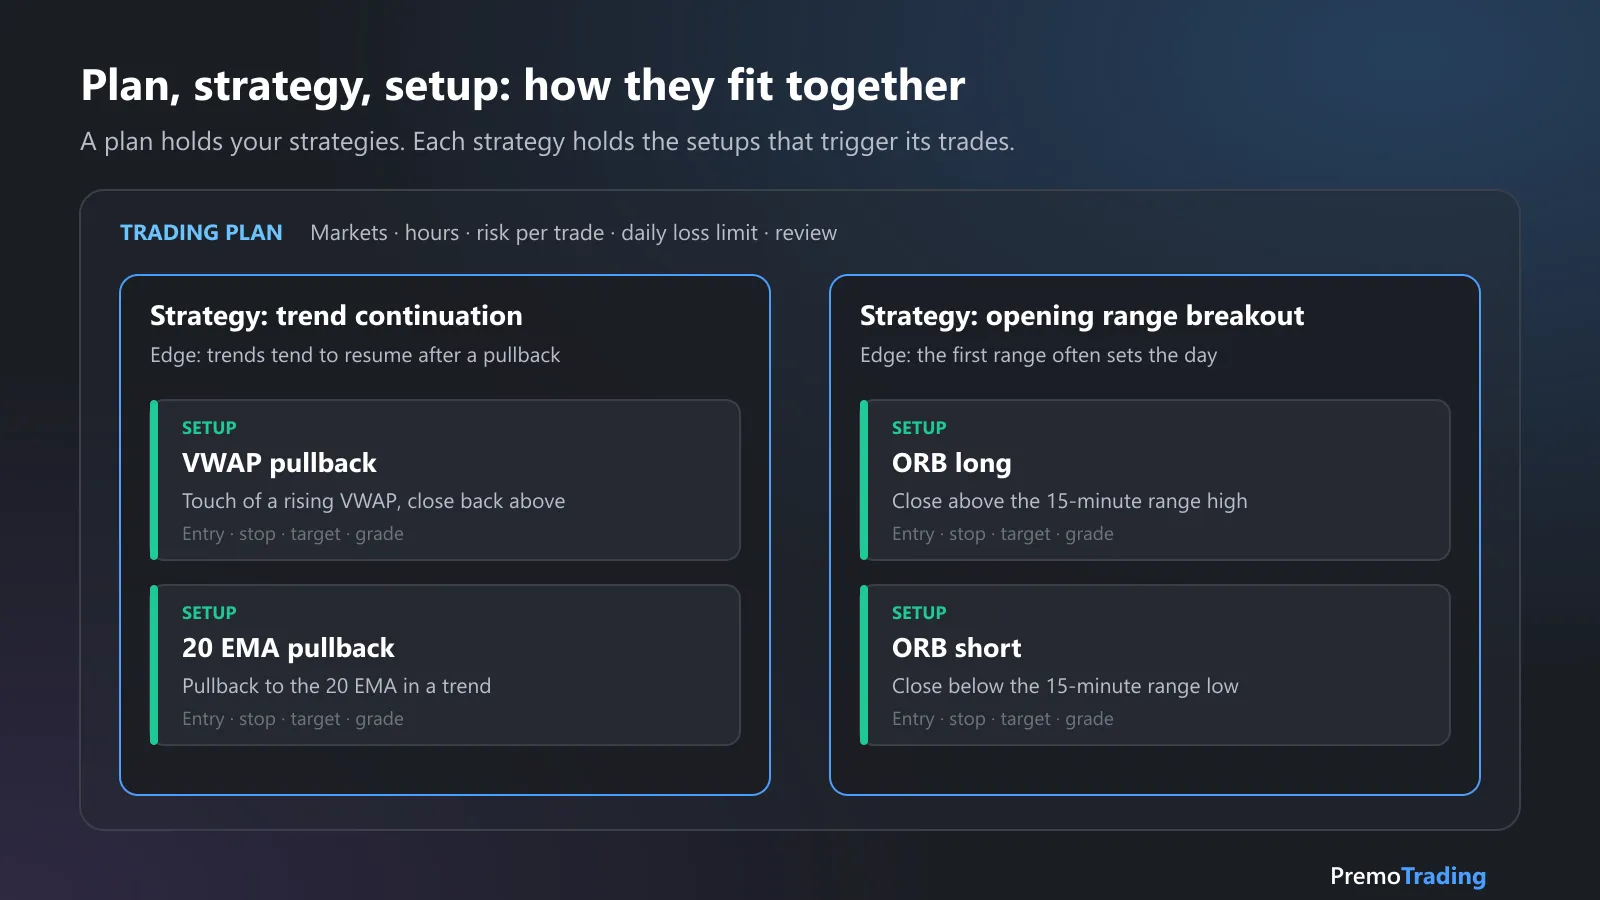
A plan holds your strategies. Each strategy holds the setups that trigger its trades.
If you haven’t written your plan yet, start with our guide on how to create a trading plan. For setups - what makes an A+ setup and how to grade them - see trading setups.
The 7 parts of a trading strategy
Each part answers one question you would otherwise answer in the middle of a trade. Leave one out and you’ll find yourself deciding it under pressure, which is exactly when decisions are worst.
The trading strategy checklist
A complete strategy answers all seven, in writing, before the session.
- 1. Market and timeframeWhat you trade, on which chart, and in which hours.
- 2. EdgeWhy this should make money more often than chance.
- 3. SetupThe conditions that must be present before you look for an entry.
- 4. Entry triggerThe exact event that puts you in the trade.
- 5. StopWhere the idea is proven wrong, decided before entry.
- 6. Target and managementWhere you take profit, and what you do in between.
- 7. Position sizeHow much you risk, as a fixed share of the account.
1. Market and timeframe
Name the instrument, the chart and the hours. Strategies behave differently across markets and times of day: a pullback strategy that works in the first two hours of the New York session may do nothing in the afternoon.
Example: “MNQ, 5-minute chart, 9:30 to 11:30 a.m. ET.”
2. Edge
The edge is the reason the strategy should work - the market behaviour it is built on. You don’t need a PhD-level thesis, but you need one sentence. Without it, you can’t tell when market conditions have changed enough to stop.
Example: “In a trending session, pullbacks to VWAP are often bought, and the trend resumes.”
3. Setup
The setup is the picture the chart must show before you consider a trade. Write it as conditions you can check, not impressions. “Strong trend” is an impression; “price above a rising VWAP, and the 9 EMA above the 20 EMA” is a condition.
Example: “Price above a rising VWAP. A pullback touches VWAP.”
4. Entry trigger
The setup tells you to pay attention; the trigger tells you to act. Separating them stops you from entering early because the setup “looks close”.
Example: “Enter on the first 5-minute candle that closes back above VWAP.”
5. Stop
Your stop is where the trade idea is wrong - not a dollar amount you’d rather not lose. Place it at the price that invalidates the setup, then size the position so that distance equals your fixed risk. That turns every trade into the same unit, R: one R is the amount you lose if the stop is hit.
Example: “Stop 1 tick below the pullback low.”
6. Target and trade management
Decide where you take profit and what you do in between: partials, moving the stop to breakeven, trailing. Most strategies are won or lost here, because exits are where emotion is strongest. If you want to see how much your exits leave on the table, MFE and MAE measure it.
Example: “Take half at 2R, move the stop to breakeven, trail the rest under each 5-minute higher low.”
7. Position size
Size comes from risk, not from conviction. Pick a fixed share of the account per trade and work the contracts out from the stop distance. The futures position size calculator does the arithmetic.
Example: “Risk 0.5% of the account per trade. Round contracts down.”
A complete example: the VWAP pullback
Here’s the same strategy with every part filled in. It’s an illustration of how to write a strategy, not a recommendation to trade it.
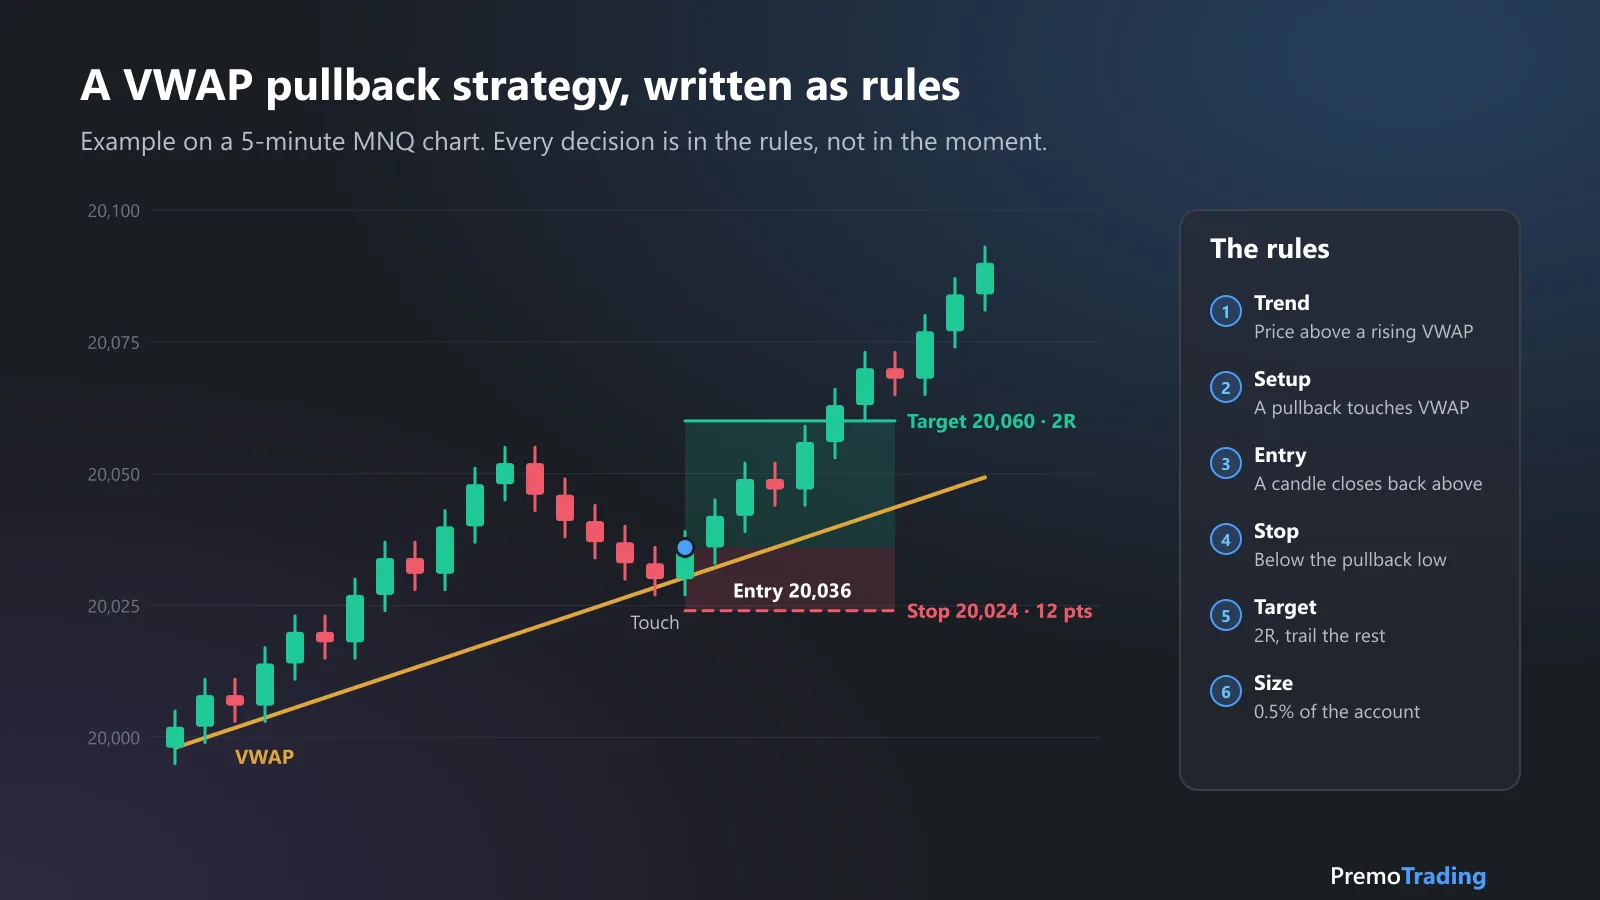
The VWAP pullback on an example MNQ chart: risk 12 points to make 24.
| Part | Written as |
|---|---|
| Market and timeframe | MNQ, 5-minute chart, 9:30 to 11:30 a.m. ET |
| Edge | In a trending session, pullbacks to VWAP tend to be bought |
| Setup | Price above a rising VWAP, 9 EMA above the 20 EMA, pullback touches VWAP |
| Entry trigger | First 5-minute candle that closes back above VWAP |
| Stop | 1 tick below the pullback low |
| Target and management | Half at 2R, stop to breakeven, trail the rest under 5-minute higher lows |
| Position size | 0.5% of the account per trade |
| Don’t trade when | High-impact news is due within 10 minutes, or VWAP is flat |
Notice the last row. A good strategy says when not to trade as clearly as when to trade. Those filters are often where most of the improvement comes from.
Types of trading strategies
Every strategy relies on one kind of market behaviour. Knowing which one tells you when your strategy should work - and when to sit out.
| Type | The edge it relies on | Works best when | Typical setups |
|---|---|---|---|
| Trend following | Moves tend to continue | The market is trending | Pullbacks to VWAP or moving averages |
| Mean reversion | Stretched prices snap back | The market is ranging | Fades at range extremes or bands |
| Breakout | Ranges resolve with expansion | Volatility is rising | Opening range breakouts, level breaks |
| Momentum | Strong moves attract more buyers | News, gaps, high relative volume | Flags, first pullbacks after a surge |
| Range trading | Levels hold until they don’t | Clear support and resistance | Buy support, sell resistance |
| Scalping | Small, frequent edges add up | Liquid markets, tight spreads | Order flow and level reactions |
Price-action traders often build strategies around specific structures, such as fair value gaps or the ICT reversal. The rules above still apply: market, edge, setup, trigger, stop, target, size.
Discretionary vs systematic
A systematic strategy is fully mechanical - a computer could run it. A discretionary strategy leaves some judgement to the trader, such as reading context. Most day traders are somewhere in between. Discretion is fine, as long as it’s written down as a filter (“skip if the trend is unclear”) rather than used to override the rules once you’re in a trade.
How to test a trading strategy
- Write the rules first. If you change them during the test, you’re testing a different strategy every week.
- Measure in R. Record each result as a multiple of your risk. That makes trades comparable across sizes and markets.
- Get enough trades. 30 is a bare minimum; 50 to 100 tells you far more. Below that, a few lucky trades can make anything look good.
- Calculate expectancy. Expectancy = (win rate × average win) − (loss rate × average loss). Positive after costs means the strategy has an edge. Try the expectancy calculator.
- Check the shape, not just the total. Look at the drawdown, the longest losing streak, and whether one outlier is carrying the result - see base hits or home runs.
- Check that you followed it. Separate trades taken by the rules from trades that broke them. If the broken ones are the losers, the strategy may be fine and the discipline isn’t.
50–100
trades before you judge a strategy
33%
win rate needed to break even at 2:1, before costs
+0.2R
a solid expectancy per trade for a day-trading strategy
The middle number comes from the breakeven formula, 1 ÷ (1 + R): at a 2:1 risk-reward ratio, you only need to win one trade in three to break even. The last is a rule of thumb, not a target: what matters is that it’s positive, stable and survives costs.
When to change a strategy - and when not to
Don’t change it after a losing day or a losing week. Every strategy has losing streaks; a 50% win-rate strategy will lose five in a row from time to time by pure chance.
Do review it on a schedule, such as monthly, and change it when the numbers say so over a real sample:
- Expectancy has turned negative over 50 or more trades taken by the rules.
- The market behaviour it relies on has changed - for example, a trend strategy in a long stretch of range days.
- One filter would have removed most of the losers. Add it, and keep testing.
Change one thing at a time, and note the date, so you can compare before and after.
Common strategy mistakes
- Rules too vague to test. “Buy when it looks strong” can’t be measured.
- No written stop. The stop gets decided when you’re already losing.
- Too many strategies. Five half-tested strategies give you five small samples and no answers.
- Judging by P&L instead of R. Bigger size on a lucky day makes a weak strategy look good.
- Ignoring discipline. Results from trades that broke the rules get blamed on the strategy.
More in 10 common trading mistakes, and on the mindset side, trading psychology.
How Premo helps you run a strategy
Writing a strategy is the easy part. Following it, and knowing whether it pays, is where traders get stuck. Premo’s Playbook is built for exactly that:
- Write each setup once: a grade from S to D, the confluences it needs, your stop and target rules and the R:R you expect.
- Review every trade against its setup: tick the confluences that were really there and any warning signs, compare the R you made with the R you planned, and grade your execution.
- Get a Confidence score out of 100 that rewards following your rules - a clean loss at your stop scores well, a lucky win that broke them doesn’t.
- See each setup’s numbers: pick a setup in Trader Summary and the statistics, equity curve and calendar follow.
- AI insights that read your Playbook tell you, every day, whether sticking to your setups actually pays.
See how the Playbook works, or how it compares with other journals on the comparison page.
Put your strategy in a Playbook14 days free, then $19.99/month plus tax. Cancel before your trial ends and you won't be charged. New customers only.
Start your 14-day free trialThis article is educational and is not investment advice. The VWAP pullback is an example of how to write a strategy, not a recommendation. Trading futures involves substantial risk of loss.
Frequently asked questions
What is a trading strategy?
A trading strategy is a written set of rules that decides which market you trade, what conditions must be present, where you enter, where you exit for a loss or a profit, and how much you risk. If two traders could follow the same rules and take the same trades, it is a strategy. If the decisions are made in the moment, it isn't one yet.
What are the components of a trading strategy?
Seven parts: the market and timeframe, the edge (why it should make money), the setup (the conditions that must be present), the entry trigger, the stop (where the idea is wrong), the target and trade management, and the position size. A strategy missing any one of these leaves a decision to be made under pressure.
What is the difference between a trading strategy and a setup?
A strategy is the complete set of rules for one way of trading, including risk and management. A setup is the specific market picture that tells you the strategy's trade is on - for example, a pullback that touches a rising VWAP. One strategy can have several setups.
What is the difference between a trading strategy and a trading plan?
A trading plan is the business around your strategies: which markets and hours you trade, how much you risk per trade and per day, and how you review. A plan holds one or more strategies, and each strategy holds its setups.
What are the main types of trading strategies?
The most common are trend following, mean reversion, breakout, momentum, range trading and scalping. They differ in the edge they rely on and the market conditions they need: trend strategies need trending days, mean reversion needs ranges, and breakouts need volatility expansion.
How many trades do you need to test a trading strategy?
Enough for the results to mean something. Many traders treat 30 trades as a bare minimum and want 50 to 100 before drawing firm conclusions about win rate and expectancy. Fewer trades than that mostly measure luck.
How do you know if a trading strategy works?
It has a positive expectancy - the average result per trade, after commissions and fees - over a meaningful sample of trades, taken as the rules say. Check both: a strategy that loses because you broke its rules hasn't been tested yet.
What is the best trading strategy for beginners?
There isn't one best strategy. Beginners do best with one simple, rule-based strategy in one market and one session, with a fixed small risk per trade, tracked in R so the results are comparable. Simple rules are easier to follow, and following them is what makes the results meaningful.